Data Utility
The Data Utility is used to update data in several documents at once. It loads and displays current values, and then saves the changes you make. It can be opened at any hierarchy level and will update all documents of a particular type under the selected node (see Load and edit values). For example, you can use it to update production rates in all of the fields in an area, or to specify general settings for several regions within a country. You can also use this tool to import and export data from Dataflow (see Export to clipboard and Import from clipboard). When you open the tool, a new tab Data Utility is added to the ribbon; its buttons are described in the table below.
To open the Data Utility tool click the Data Utility button  in the Tools section on the ribbon. The tool opens in a separate
tab in the document pane so you can open it several times against different nodes of the hierarchy (or even against the same node).
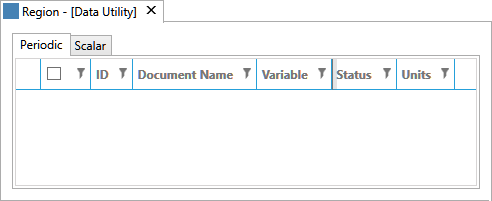
The Data Utility screen contains two tabs. The Periodic tab contains variables with multiple values, for example, capex or production rates. The Scalar tab contains variables that have only one value, for example, working interest shares, field locations or country names.

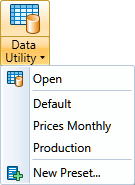
Before editing data, you need to specify which values you are going to change. These settings are stored in presets. If you click the arrow
under the Data Utility button  , you will see the presets which have been added to the quick launch list (see the screenshot below); select a preset
from the list to view data with these parameters. If you click this button, the default preset will be used. If you do not have a preset,
you can create one (see Data Utility presets).

Data Utility tab buttons
| Item | Function |
|---|---|

|
Saves the current preset if its settings have been changed. If you click the arrow underneath this button, the Save New option will be displayed which saves the current preset under a different name. |

|
Creates a new preset (see Data Utility presets). |

|
Shows the list of existing presets. To open a preset, select it from the list. |

|
Opens a window where you can specify the preset's settings (see Data Utility presets). |

|
Deletes the currently selected preset. |

|
Shows the type of document which will be edited. |

|
Contains the list of available tags to identify loaded scenarios. The Include inactive tags box underneath is used to include inactive tags in this list as well. |

|
Opens the Variable Selector window where you can choose which variables you want to edit. The Only show editable check box is used to filter out variables that cannot be edited for some reason (for example, the documents containing them are locked). |

|
Links items on the Scalar and Periodic tabs so that they can be loaded and submitted together. |

|
Show the first and last dates for which values will be loaded. |

|
Shows the periodicity in which values will be displayed. You can use a standard periodicity (Annually, Semi-Annual, Quarterly, Monthly) or a custom combination of periodicities (Mixed). |

|
Loads data according to the selected preset. |

|
Copies values into the clipboard (see Export to clipboard) or into a CSV file (see Export to CSV). |

|
Copies values from the clipboard (see Import from clipboard) or from a CSV file (see Import from CSV). |

|
Saves changes to the loaded values. |
