
Searching for records using the browse page, ad hoc reporting, and configuring the dashboard.
Overview
The browse page and dashboard are where users can search and report on all document types (AFEs, RTDs, etc.) and quickly find their work. Each document type has a browse page that allows you to perform quick ad hoc searches and create reports. Reports that you create in the browse page for primary documents can be configured to show on your dashboard.
The dashboard is an attempt to create a one-stop shop for users to find the information that is important to them. By default, the dashboard shows primary documents (AFEs, RTDs, etc.) requiring your attention or input based on your role in Aucerna Execute.
Browse Page
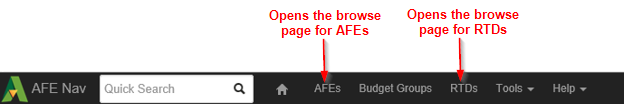
Each document has its own browse page where you can search for records and create reports. If you have been granted create rights to a document type, the browse page has buttons to create the new document. To access the browse page for a primary document, click on the document name in the toolbar.
For other document types, you can view their browse page by selecting Tools > Configuration and searching for the document name. Then, click the view items button beside the document name to see its browse page.
List of Reports
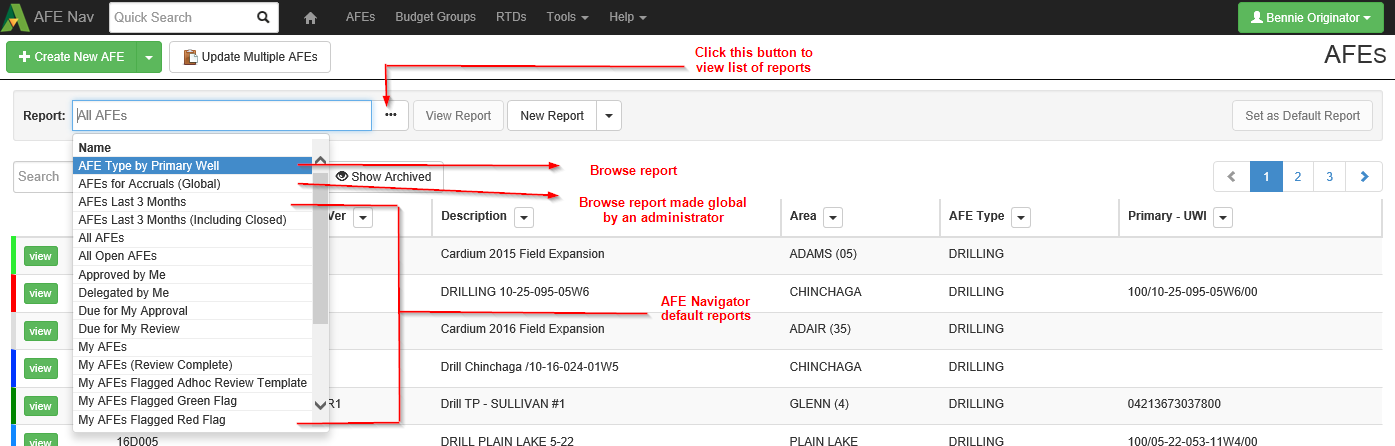
At the top of the browse page, you can select from a list of reports to control the records being viewed. This list includes Aucerna Execute default reports, browse reports you created or reports an administrator has created and made “global” for your company (the word Global appears in brackets after the report name). When you select a browse report, you will see the records and columns determined by the report.
Click image to expand or minimize.
If you select a global report, you can click the View Report button to see the report outline. This may be helpful in order to see the filters and sorting applied to the report and the name of the report owner. You will not be able to edit a global report (unless you are the owner of that report) or any of the default Aucerna Execute reports. You will only be able to edit your browse reports..
Configuring your Columns
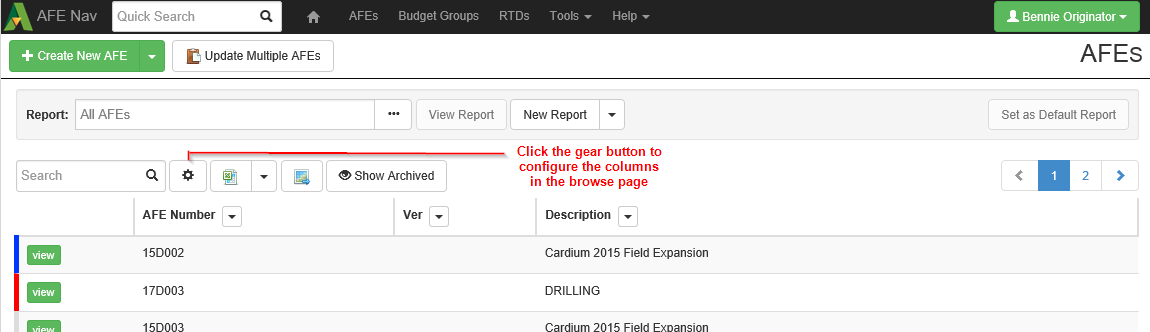
You can configure the columns in the browse page when you are viewing any of the default Aucerna Execute reports or any of your browse reports that don’t specify the columns to include. To configure columns, click the gear button.
Click image to expand or minimize.
Click the Change Visible Columns list to see a list of available fields that can be displayed as a column. You can search for the field name in the window at the top of the list. To select a field for display, click on the field name in the list. Once you have selected all the columns, click off of the list window to close it. To reorder the columns, drag and drop the column to where you want it displayed (the top of the list represents the first column on the left of the page). Click OK to save your changes.
Click image to expand or minimize.
Searching
You can search for records by typing in the Search window. When you type in the search window, it will search for that value across all the displayed columns and filter the records accordingly.
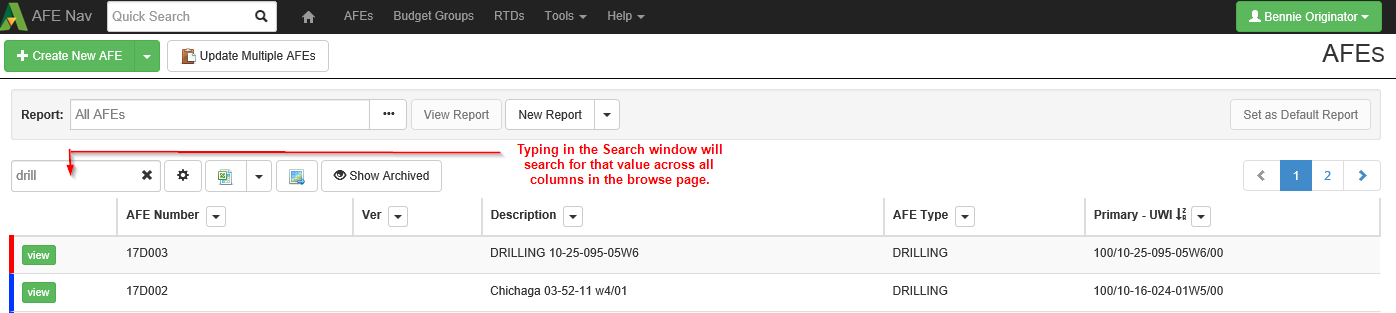
Click image to expand or minimize.
Column Filters and Sorting
You can create a filter for any column in your browse page. Yocan also specify a column to apply an ascending or descending sort.
To build a filter on a column, click the arrow button by the column title and select Edit Filter. The filter window will differ depending on the column’s field type (ex: list, text, date, etc.).
To apply sorting to the records in the browse page, click the arrow button by the column title and choose between ascending or descending sort.
Click image to expand or minimize.
Status Colors
At the beginning of each row in the browse page, you’ll notice a band of color. The color represents the status of the document.
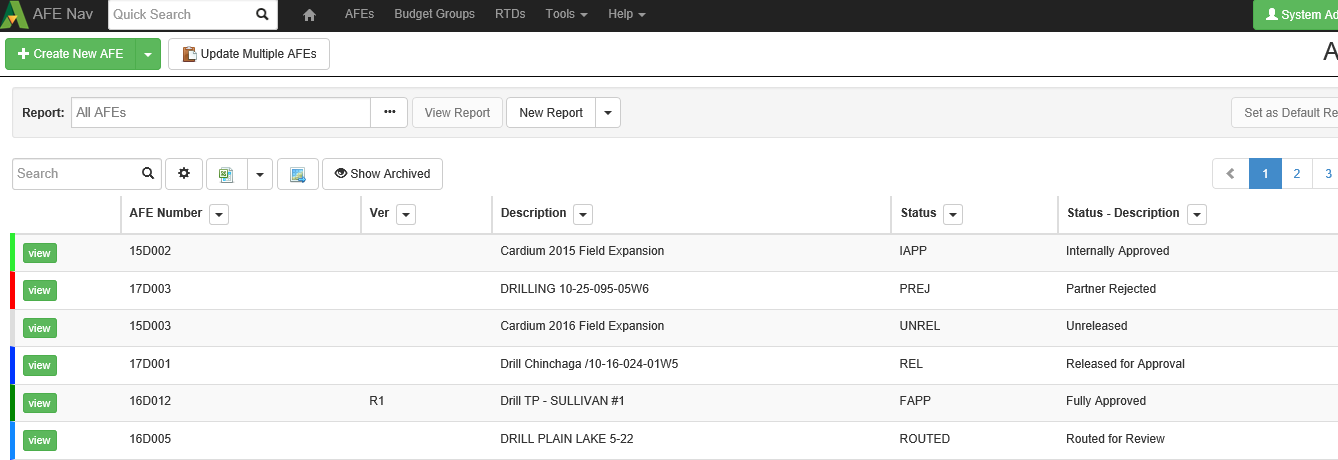
Click image to expand or minimize.
Below is a legend that explains the status color assigned to the AFE, RTD and other document types.
| Color | AFE Status | RTD Status | Other Documents |
|---|---|---|---|
| Grey | Unreleased | In Progress | Active |
| Light Blue | Routed for Review | N/A | N/A |
| Dark Blue | Released | Released | N/A |
| Light Green | Internally Approved | Approved | N/A |
| Dark Green | Fully Approved | Licensed | N/A |
| Red | Either Internally Rejected or Partner Rejected | Rejected | N/A |
| Black | Closed | Closed | In-active |
Export to Excel
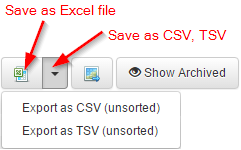
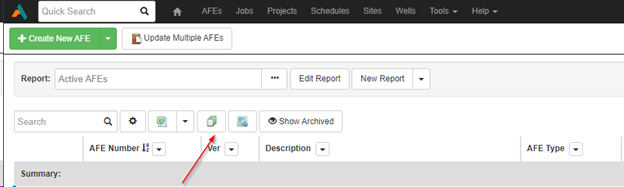
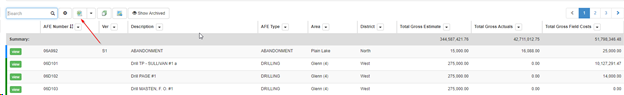
Aucerna Execute allows users to save the results of a filter or a sort. Click the Export to Microsoft Excel button to save the result set as an Excel spreadsheet. Click the arrow button beside the Excel button to save as either a CSV or TSV file.
The exported spreadsheet contains a column that contains a link to the document. When you click on the link, Aucerna Execute will launch (provided you have access to it) and open the document referenced in your spreadsheet.
Click image to expand or minimize.
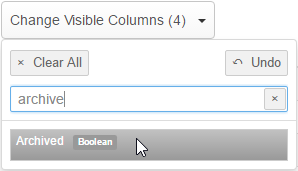
Show Archived
To improve performance of the browse page, archived documents will not show up in searches by default. An administrator can control the criteria that determines whether a document is considered an archived record. If you want to see all the records in the browse page that apply to your search, click the Show Archived button. While viewing archived records, the Show Archived button becomes Hide Archived. Additionally, an “Archived” column (type Yes/No) is available to documents types that have an archive rule.
For more information regarding archiving rules, see the Archiving Documents guide.
Browse Reports
A browse report is a report you create in the browse page so you can quickly recall a set of filters and visible columns. In previous versions of Aucerna Execute, we referred to these reports as custom filters. Browse reports can be a big time saver if there is a set of criteria that you regularly use to search for documents. You can find your browse reports in the list of reports at the top of the browse page.
Report Types
When you create a browse report, the first step is to select the report type. You can see the report types when you click the arrow button beside the New Report button. If you want to report on “top-level” data, select the report type that is the same as the document name (ex: AFEs, RTDs, etc.). If you need to report on child records of your document, select one of the other report types (ex: reporting on AFE or RTD approvals data, AFE or RTD partners, AFE costs per account, any data from a table, etc.).
Creating a Browse Report
To create a browse report, click the arrow button beside the New Report button and select a report type. In the Configuration tab, you must enter some general information like the report name and whether to include archived records. Only an administrator with the Manage Reports privilege can set the report as a global report. The search box works the same as the search box in the browse page; it will search for the value across all visible columns to filter the records returned.
The Available Columns window contains a list of fields you can include as columns, filters or sort criteria. In this list you will find fields on the document, as well as calculations and pre-canned filters (ex: My Work, Due for My Approval, All Open AFEs, My In Progress RTDS, etc.) To build your report, drag the items from the Available Columns window to the Visible Columns, Filter and Sort windows. To save your report, click Done Editing & Close.
Click image to expand or minimize.
Reporting Calculated Columns
Aucerna Execute supports the creation of Calculated Columns for reporting. Calculated Columns can be based on values available on that report row and can be used to perform calculations, comparisons, and calculate custom KPIs.
Aucerna Execute supports two types of Browse Report Calculate Columns:
- Global Report Calculated Columns – Defined by an Administrator and available to all users
- Report Calculated Columns – Defined by the author of any Browse Report and available only within that report
Creating Global Report Calculated Columns
Before you create a Global Report Calculated Column, you should also be aware there is also the option to add a Document-level Calculated Field (see Creating a Calculated Field). Global Report Calculated Columns only available for use in reports, while Document-level Calculated Fields behave like a regular field on a Document and are available throughout Aucerna Execute.
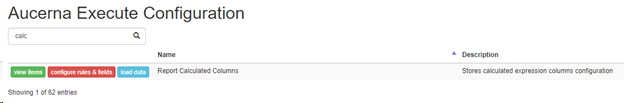
Global Calculated Columns can be created by an administrator with the “Manage Calculated Columns” privilege. Global Calculated Columns are defined by navigating to “Tools > Configuration > Report Calculated Columns (view items)”
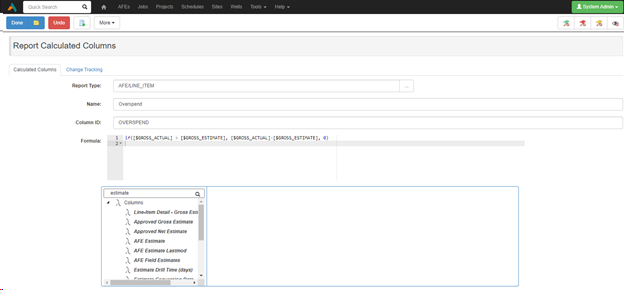
When creating a new Report Calculated Field (by clicking “Create Report Calculated Column”), you will be required to select which Report Type this calculated field applies to (i.e. AFE, Job, AFE – Line-item, …).
You must enter a Name that will be shown to users when building reports and should uniquely identify the column.
You must also provide an ID for the new Report Calculated Column, which must be unique. The system will try and generate this for you (based on the Name), but it can be adjusted. A Calculated Column’s ID may never be modified after the Calculated Column is created.
Finally, you must provide a Formula that defines the logic/expression for the Report Calculated Column. Formulas are defined similarly to Excel formulas, and the toolbox under the formula box makes it easy to find available columns and functions with which to build your formula. For more detail on building formulas, see Building Formulas.
The following example is an “AFE – Line-item” level calculated field called “Overspend” that returns the amount that the Actuals on an account exceed the Estimate for that account (if they do).
Global Report Calculated Fields are available when building reports or configuring visible columns of the target Report Type.
Global Report Calculated Columns can be deleted (More > Delete), which will immediately remove them for any users referring to that column.
Creating Report Calculated Columns
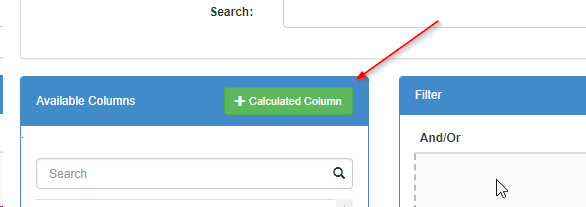
As an author of a Browse Report, you can add calculated columns to your report. Those columns are only available within that report. New Calculated Columns are added by clicking “+ Calculated Column” while in the Report Editor.
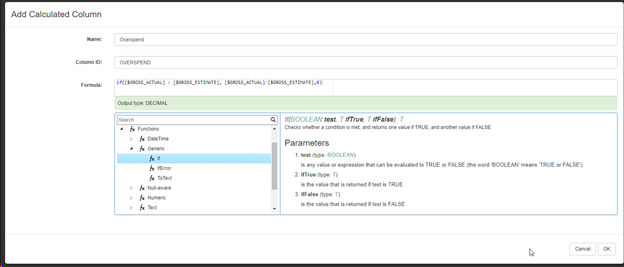
When creating a new calculated column, you must provide a Name for the column, a unique ID for the column (which can never be modified), and a Formula.
Formulas are defined similarly to Excel formulas, and the toolbox under the formula box makes it easy to find available columns and functions with which to build your formula. For more detail on building formulas, see Building Formulas.
The following example added to an “AFE – Line-item” level report and creates a calculated field called “Overspend” that returns the amount that the Actuals on an account exceed the Estimate for that account (if they do).
Once created, the new Calculated Column shows in the list of Available Columns for the report.
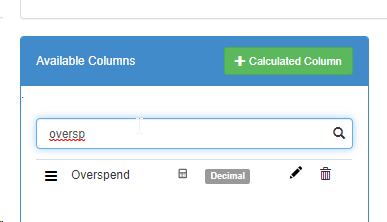
You can click the pencil icon to edit the Name or Formula for a calculated column and the trash icon to delete it.
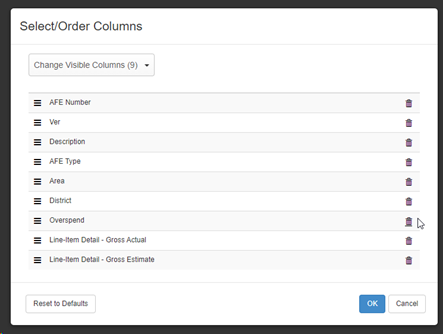
Once created, Calculated Columns behave like standard report columns and can be used in filters, for sorting, or displayed (by dragging them into the visible section or selecting them from the ad hoc column picker).
Building Formulas
The syntax for created Calculated Columns & Calculated Fields is intended to be intuitive and Excel-like. The following is intended to be a quick guide on getting up and running with the formula editor.
When editing a formula, you can type into the formula box directly, and you can use the toolbox.
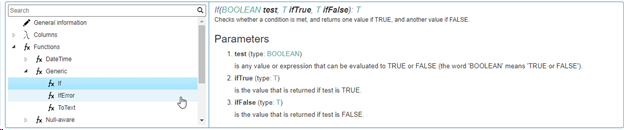
The toolbox underneath the formula field provides a list of columns/fields and functions available to build your formula with. Clicking on a function (like below) will provide you with help on using that function. Double-clicking a field or function in the toolbox will insert the appropriate code into the formula box above.
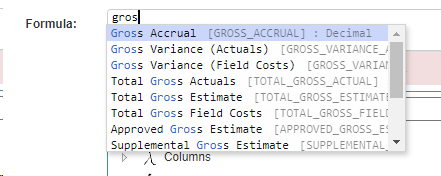
When typing into the formula box directly, the formula editor supports Auto-Complete, which means you are able to type into the formula box, and the system will show you a list of matching fields and functions. Use the arrow keys to select the appropriate field or function and press enter to fill in the correct code.
Formula Validation
The system will automatically validate your formula and display a green success message or a red error message.
The following is an example success message which indicates the expected Output Type of your formula (number, text, date, etc.):

The following is an example of an error message indicating that I’ve missed one of the expected parameters to the “if” function.

Null / Empty-value Handling
Sometimes fields are empty and don’t (yet) have a set value (we’d call these “Null” values). By default, the formula evaluator will convert Null values to “safe” default values.
| Data Type | Default Value |
|---|---|
| String | (empty string) |
| Number | 0 |
| Date | (empty date) |
| Boolean (Yes/No) | No |
Sometimes, it is essential to be able to build formulas that can differentiate between a Null value and the default value (for example: is the “Chance of Success” actually zero, or has it not been filled out yet). For these situations, we have two functions:
- IsNull – returns a “yes” (true) if the field is Null (has no value) and “no” (false) if it has a value
- Either – returns an alternative default value if that field is Null (empty)
Sharing a Browse Report
Browse Reports can be shared with other users. While viewing the report, copy the URL and send it to the person you want to share with. When the other user visits the URL, the report shows up under their list of reports in the browse page.
If that shared report is one you’d like to keep, click View Report > More > Copy Report. After copying the report, you are free to make edits without affecting the original report. Click Done Editing & Close to save the changes.
Excel Browse Reports
Excel Template Browse Reports provide a convenient, lightweight reporting solution for Excel-based reports and allow users a streamlined method for exporting data into preconfigured tables, pivot tables and pivot charts. Template Report files (Excel sheets containing pivot tables, charts, macros, etc.) can be placed into a specific network folder, which can then be selected from the Browse screen. Aucerna Execute will update the data in that template sheet and return the updated sheet to the user. This simplifies and automates workflows where a user periodically extracts data from Aucerna Execute and performs a consistent set of manipulations on that data for reporting purposes (adding charts, pivots, formulas, etc.).
Running an Excel Browse Report
Published Excel Template Reports can be accessed from the Browse page and will be filled in using the data in your current result set (your filters).
The Excel Template Reports available are filtered based on report type, ensuring that you will only ever see applicable Template Reports. For example, if you are currently looking at a list of AFEs, you won’t see Jobs, Schedule, or even Line-item AFE detail-level Template Reports.
The current report/filters are used to select which rows (usually this means which “Documents” (AFEs, Jobs, …) are sent to the Template Report. The columns you have selected in your report are irrelevant when running Excel Template reports since the system will use the columns defined in the Template Report. For example, if your Template Report has columns for AFE Status and Description but those columns are not currently visible in your Browse screen the Template Report will still populate with the AFE Status and Description information.
All Excel Template Reports are global (meaning that all users can see all reports). There is currently no such thing as a “Private” Excel Template Report.
Building an Excel Browse Report
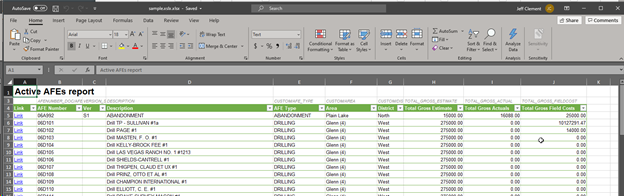
The easiest way to build a template report is to start with Aucerna Execute’s Browse page. Configure the Browse screen to include the columns required for your Excel template and export to Excel.
Save this file into your TemplateReports folder (usually “TemplateReports” under your environment’s Network Components folder (you can find the “Network Components Path” under Help > About). If you don’t have permission to write to this folder, you can build your report and then forward this Excel file to an Aucerna Execute Administrator to have it published (note: at this time, all Excel Browse Reports are available to all users).
-
Rename the tab to “Data” (not necessary, but it makes it easier to keep track of things)
-
Remove most (but not all) of the rows of data. While there is no technical requirement to remove the rows of data in the export as they will be removed and overwritten when a user exports data from the Browse screen, it’s a good practice to do so to ensure confidential data isn’t left in the template.
-
(NEVER) Remove any columns from the Data tab
-
(NEVER) Add any new columns to the Data tab
-
(NEVER) Remove or alter Rows 1 through 4 of the Data tab
-
-
Now, add additional sheets with whatever logic is required for your reporting. For example, here is the process to add a new Pivot Table.
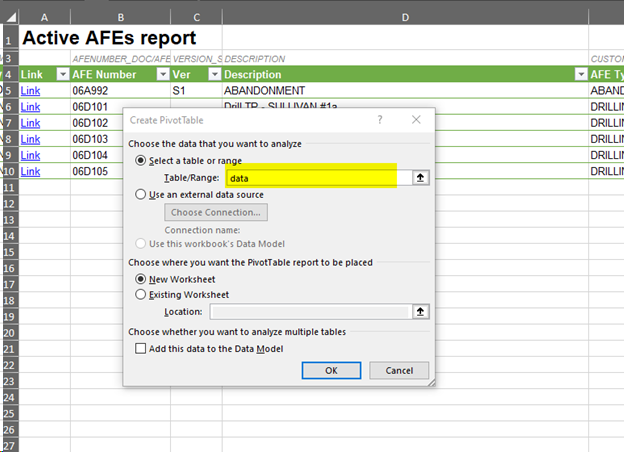
Note that, wherever possible, you should try and use the built-in Table / Named Range called “Data.” This way, your logic/macros will respond correctly when new data is loaded and the number of rows of data changes.
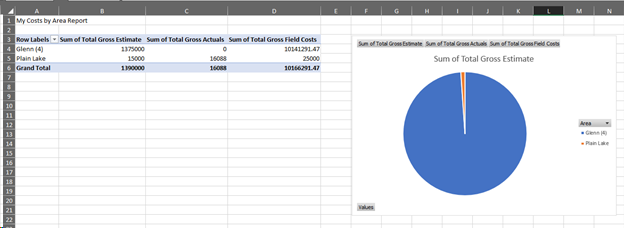
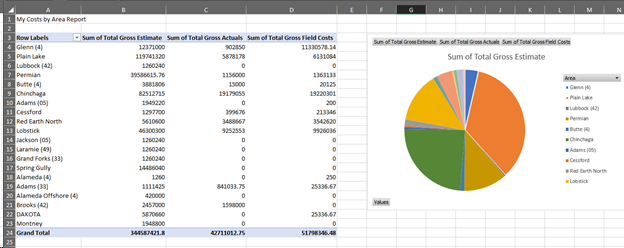
Here is a simple Pivot Table and associated Chart, using the Data from the Data tab.
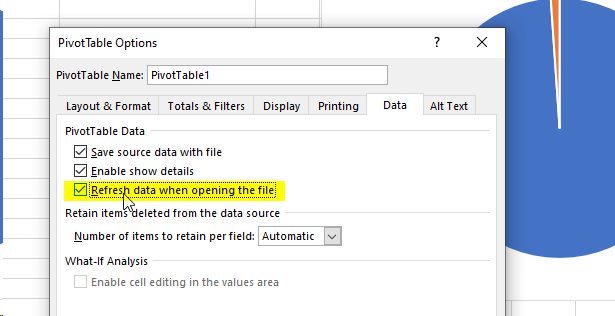
When adding Pivot Tables, it’s usually a good idea to set them to Refresh when the Excel sheet is loaded. Right-click on the Table and select “Properties” and ensure “Refresh data when opening the file” is selected.
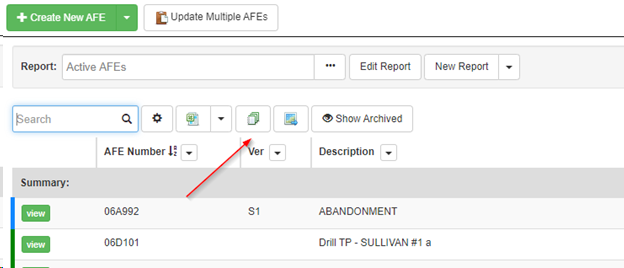
Save this Excel file. Now, from the Browse Page, select “Export Excel Report”.
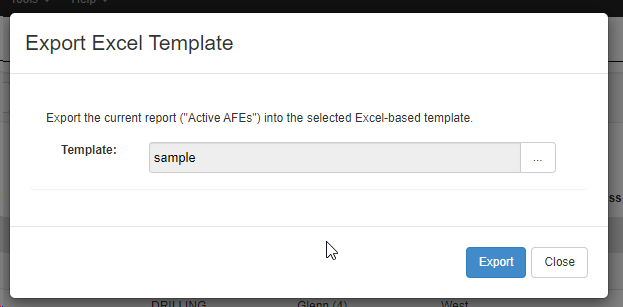
And select your new report from the drop-down list.
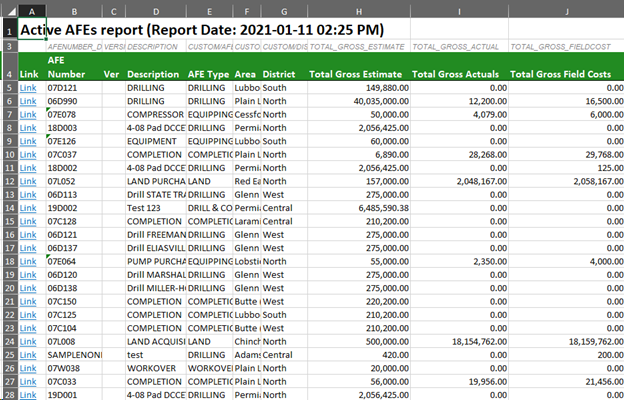
Notice now that the Data tab is filled out with all of the Browse Page data (honouring whatever filters you might have in place).
And the new Pivot Table tab is updated as well (you will have to “Enable Editing” on your downloaded sheet).
Additional tables, charts and logic can be added in a similar fashion. Changes to an Excel template will apply to subsequent runs of that report.
Dashboard
What is the Dashboard?
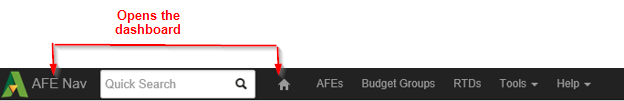
The dashboard is the first page you see when you launch Aucerna Execute. It can also be accessed at any time by clicking on the home button or AFE Nav in the toolbar.
Depending on your role in Aucerna Execute and the work that is on your plate, different buttons and widgets appear. If you have rights to create a primary document (AFEs, RTDs, etc.), you will see buttons to start one of these documents (ex: Create New AFE). As a document owner, you will see widgets highlighting your documents that require your attention, like AFEs owned by me that are on hold or internally rejected, AFEs and RTDs waiting to be released for approval, my AFEs that require a supplement, and AFEs and RTDs that are moving slowly through the approval phase. If you are a reviewer on AFEs or a discipline lead on an RTD, you will see those documents requiring your input. An approver will find AFEs that are due for their approval. Administrators may see documents that are stuck in the workflow, documents that can be closed, and documents that can be exported to or imported from another system, like AFELink.
Configuring your Dashboard
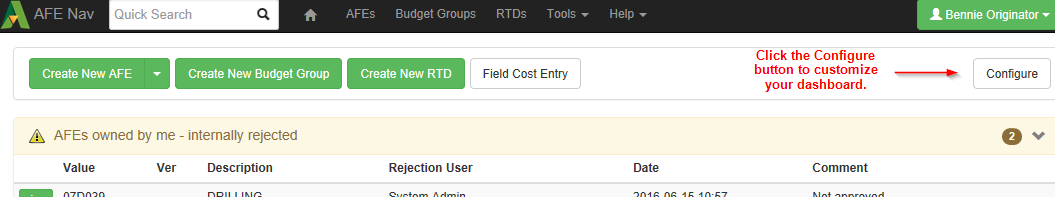
You can customize the display of your dashboard by moving widgets, hiding widgets or displaying your browse reports or global browse reports. Click the Configure button to customize your dashboard layout.
When configuring your dashboard, you’ll notice that widgets are either labeled as System or Report. A system widget is one that is included in the application and a report widget is either one of your browse reports or a browse report that was made global by an administrator. You can move widgets by dragging and dropping them into the different windows. If there is a widget you do not want to see on your dashboard, click the trash can button and it will remove the widget from display and move it into the Available Widgets window. Widgets that display documents that require your input in order to move forward in the workflow cannot be removed from your dashboard, however, you can change where they are displayed. The Available Widgets window contains a list of unused widgets, your browse reports and global browse reports.
To save the changes to your dashboard layout, click Done Editing & Close. You can also click the Revert to Default to return to the default dashboard configuration in Aucerna Execute.
Click image to expand or minimize.