
About Type Wells
Type Wells display an averaged representation of the production history for a sample of wells with a forecast based on that history. Value Navigator® normalizes the start of each well’s production history to time zero and calculates an average of the combined history starting from that date. It is possible to use either only history, or history plus forecast in the normalization calculation. The forecast is then based on the type well’s history, or history plus forecast
Well Cut-off Point
Value Navigator® does not automatically use all of the production history for all wells in the sample to create a type well. The amount of total production history used to create the type well is determined by the percentage selected for Well cut-off point in the Create Type Well dialog box. This applies if history or history + forecast is used for the type well, but will have more influence on type wells that use only history.
When looking at the production history of a sample, Value Navigator® starts all wells at a common start date. Because each well has a different amount of production history, the sample’s well count decreases over time. The Well cut-off point option allows you to select what percentage of the wells is still producing (remaining) before cutting off the production history. For example, if the sample consists of 100 wells, entering 0% as the cut-off point runs all wells to completion. In other words, 0% means “run all wells until 0% remains.” Similarly, selecting 75% as the cut-off point runs the full production history of 25 wells because once 25 wells have dropped from production there are 75 remaining (Figure 1).
The higher the percentage indicated for Well cut-off point, the less production history that will be used to create the type well (see Figure 1). Generally, the more wells used to create the type well (providing a larger data sample), the higher the percentage that may be used. For a small number of wells the percentage may be lower, resulting in a larger amount of the available production history being used to calculate the type well forecast.
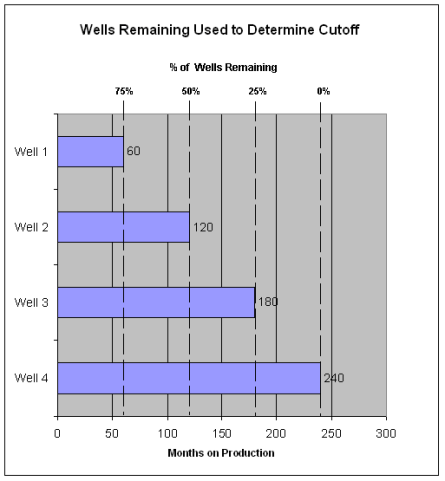
Click image to expand or minimize.
Figure 1: The higher the % of wells remaining, the less production history is used to create the type well. With 50% of the wells remaining, 120 months of production are used to create the type well. With 25% of the wells remaining, 180 months are used.
Gap Wells and Shut in Wells
When only production history is used to create a type well, it is important to distinguish between wells that have been shut in and those that simply have no more production history. A gap well is a well that has run out of production data, but is still assumed to be producing. A shut in well is a well that has not produced for a number of months greater than the User Options: Import Parameters setting and does not have a forecast which would indicate that production will resume in the future.
Gap wells and shut in wells are used differently in the type well calculation. When a gap well runs out of production data, the total well count is reduced by one and the sum of all remaining wells’ production is divided by the number of remaining wells. In other words, the gap well is removed from the type curve calculation. Its production rate assumes the average rate of the remaining wells. However, when a well is shut in, the well count used to calculate the type curve is not reduced. Therefore, the shut in well’s production, which is zero, is still used to calculate the average production of the remaining wells.
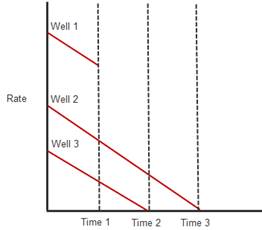
See the graph below for an example of how the type well calculation changes as gap wells run out of production data and wells become shut in.
 |
|
In the graph above, at Time 1, Well 1 has run out of production data, but is not shut in and is assumed to be producing. At Time 2, Well 3 is not producing and is considered a shut in well. At Time 3, only Well 2 is producing, but Well 3 is still being used in the type well calculation with a producing rate of zero.