
Edit Graphs
Once you have Create a New Graph, Create a Graph Version or Create a Graph Copy , the Graph Designer is displayed. The procedures below explain how to build and edit a graph.
Add a Region, Y Axis, or Series
Use the procedures below to add, delete, or move a region.
| To | Do this |
|---|---|
| Add a Region, Y axis, or Series |
Click one of these options: 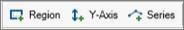 . .
|
| Delete a Region, Y axis, or Series |
Click the item in the bottom left of the Graph Designer and click  or right-click and click Delete or right-click and click Delete |
| Move a Region up or down |
In the bottom left of the Graph Designer, click the Region and then click  . .
|
To edit a Region, click  and edit the following options:
| Option | Description |
|---|---|
| Name | Naming a region enables you to assign Y axes to it. |
| Relative height | This is the height relative to the full graph size. |
Edit Graph Options
To edit the Graph Options, click  and edit the following options:
| Option | Description |
|---|---|
| Description | The description is displayed below the graphs list in the Select/Manage Graphs dialog box. |
| History and forecast start | Displays or hides history and forecast |
| Volumetric recoverable | Displays or hides volumetric recoverable, if available. |
| P/Z recoverable | Displays or hides P/Z recoverable, if available. |
Edit the X Axis
To edit the X axis, click  and edit the following options:
| Option | Description |
|---|---|
| Label | The label is displayed below the X axis. |
| Major lines | The major X axis lines (vertical) are displayed. |
| Minor lines | The minor X axis lines (vertical) are displayed. |
| Axis type | The type of data displayed on the X axis. |
Edit the Y Axis
To edit the Y axis, click  and edit the following options:
| Option | Description |
|---|---|
| Label | The label is displayed vertically on the Y axis in the Region selected below. |
| Region | Region in which the Y axis is displayed. |
| Location | Specify the left or right side of the graph. |
| Scale | Select Linear or Log. |
| Scaling factor | Select a percentage. |
| Major lines | The major X axis lines (vertical) are displayed. |
| Minor lines | The minor X axis lines (vertical) are displayed. |
Edit a Series
To edit a Series, click  and edit the following options:
| Option | Description |
|---|---|
| Field type | Select the production, injection, ratio, or other data to be displayed on the series. |
| Data type | The data type depends on the field type selected. |
| Axis | Select the axis on which to display the series. |
| Show labels | Always: Labels are always displayed. With Data: Labels are only displayed when there is data. |
| Legend label | The legend label is displayed at the top of the graph. |
| Axis label | Hides or displays the units for the current axis. |
| History | If selected, displays history in the currently selected colour. |
| Forecast | If selected, displays forecast in the currently selected colour. |
| History and forecast | If selected, displays history and forecast in the currently selected colour. |
| Daily | If selected, displays daily production in the currently selected colour. |
| Backfit | If selected, displays the decline backfit in the currently selected colour. |
| Autofit decline | If selected, displays the autofit decline in the currently selected colour. |
| Autofit points | If selected, displays the points used to create the autofit decline in the currently selected colour. |
| Autofit source points | If selected, displays the points used to create the autofit decline in the currently selected colour, on the source data. |