
Create a Graph Version
Graph versions are graphs based on a source graph and related to it. Graph versions are variations of their source and are automatically displayed when the selected entity’s Product List or Entity Type matches the graph’s criteria.
In Value Navigator, some graphs have versions built in. For example, the Rate/Cum & 1 + WOR/WGR graph has three versions: Gas, Oil, and Primary Product. When you view the Rate/Cum & 1 + WOR/WGR graph for various entities, you do not need to select the Gas version for gas entities or the Oil version for oil entities—Value Navigator automatically detects the entity’s product and displays the appropriate graph version. The Primary Product version is automatically displayed for entities with any product other than oil or gas.
With the Graph Version Manager, you can create custom versions of graphs based on an entity’s Product List or Entity Type. The appropriate graph is automatically displayed so you don’t need to select a separate graph for each entity.
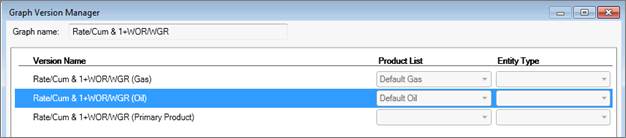
The Rate/Cum & 1 + WOR/WGR graph in the Graph Version Manager. The Primary Product version is used when the product list is anything but oil or gas.
Creating a Graph Version vs. Creating a Copy of a Graph
When you create a graph “version” you are creating a graph that is related to its original graph. The version is not displayed in the graph list—only the original graph is in the list. When you want to view a graph, you select the original graph, but the new version is automatically displayed for any entity that matches its criteria (such as Product List or Entity Type).
In addition to creating graph versions, you can also copy a graph and use it to create a new “standalone” graph. The standalone graph is displayed in the graph list and is no longer related to the original—you still need to select it in the graph list when you want to view it. However, you can also create new versions of the standalone graph. See Create and Edit Graphs.
To create a graph version
- On Predictions | Declines or Predictions | Volumetrics, right-click any graph and click Select/Manage Graphs.
-
In the Select/Manage Graphs dialog box, click the report you want to make a new version of and click Edit.
The Graph Version Manager is displayed. - Select the graph version you want to copy and click Create Copy.
- Select Existing graph and enter a Version name.
- Click Save.
- In the Graph Version Manager, click Close.
-
In the Select/Manage Graphs dialog box, select the new report and click Edit.
The Graph Designer is displayed.
See Edit Graphs for an explanation of how to build the graph.