Using Reserves's reporting engine, you will be able to create bar charts and pie charts to help you visualize your data. The appearance of charts can be changed slightly while viewing them in Reserves.
Bar Charts
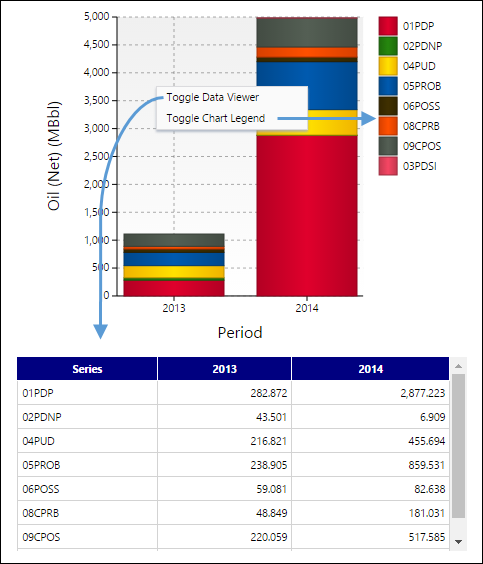
All of the bar charts created by Reserves reports are interactive. When viewing a completed bar chart report in Reserves, right click on the bar chart. You will then have the option to Toggle Data Viewer or Toggle Chart Legend (visible below).
Click image to expand or minimize.
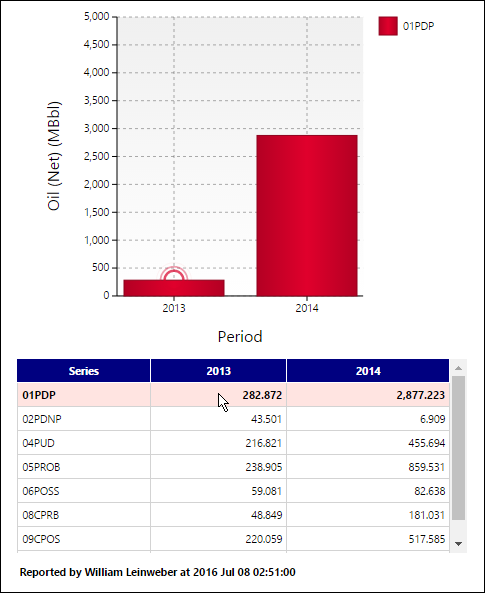
When viewing the bar charts inside of the Reserves application, you can hover your cursor over a item in the chart legend to hide all other kinds from the display. This can be particularly useful for large reports that include large product groups. This can also be done by hovering your mouse over a row in the data viewer.
Click image to expand or minimize.
Pie Charts
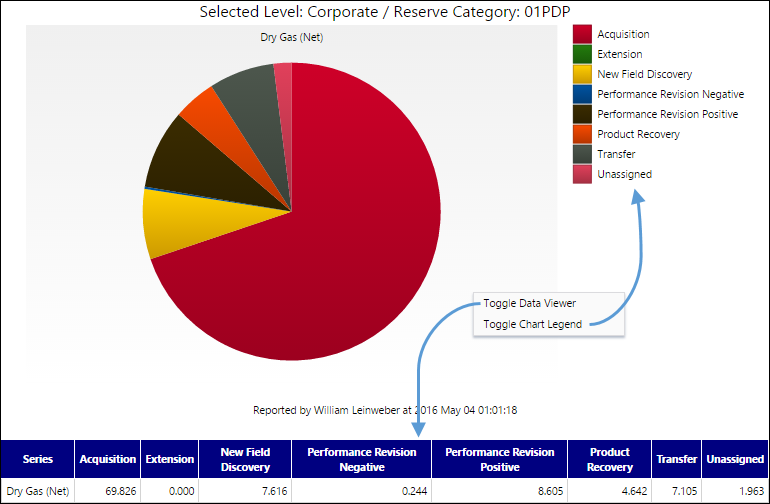
Once chart reports have been rendered, right-clicking on them will allow you to enable the data viewer and chart legend using the Toggle Data Viewer and Toggle Chart Legend buttons (visible below).
Click image to expand or minimize.
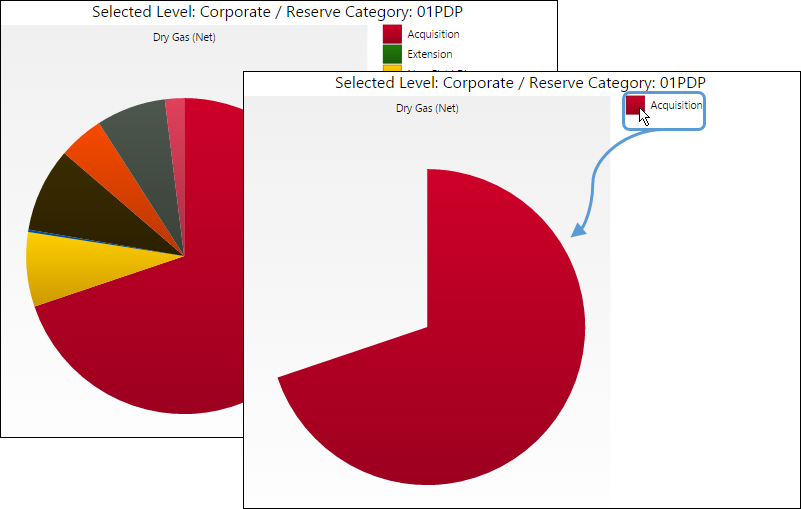
Once the data viewer and/or chart legend have been enabled, data viewers and chart legends will be included in your exported report. You can display single segments (and hide all others) of the charts by hovering your cursor over an item in the Chart Legend.
Click image to expand or minimize.
You can also display single segments (and hide all others) of the charts by hovering your mouse over a cell in the Data Viewer.
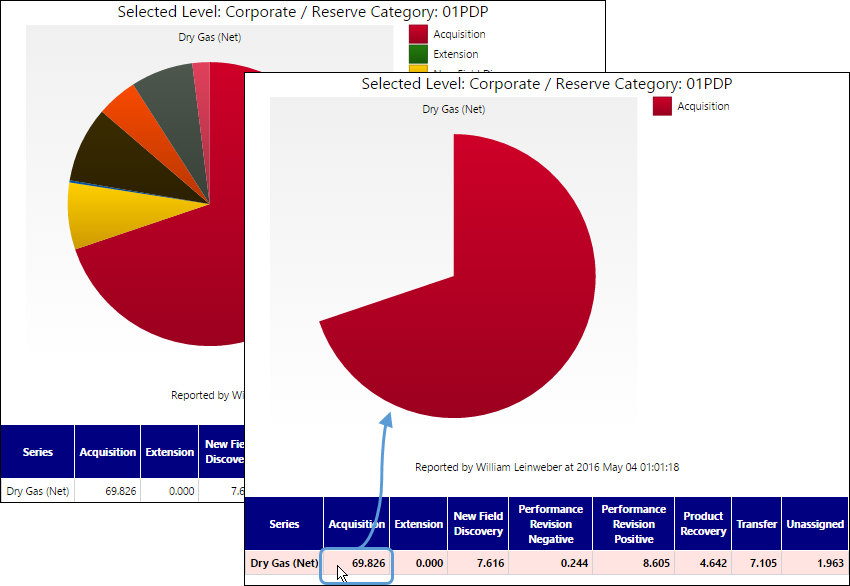
Click image to expand or minimize.
Finally, you can accentuate segments of the chart by clicking on them. The segment you click on will be moved away from adjacent segments, and the center of the pie chart (visible below).
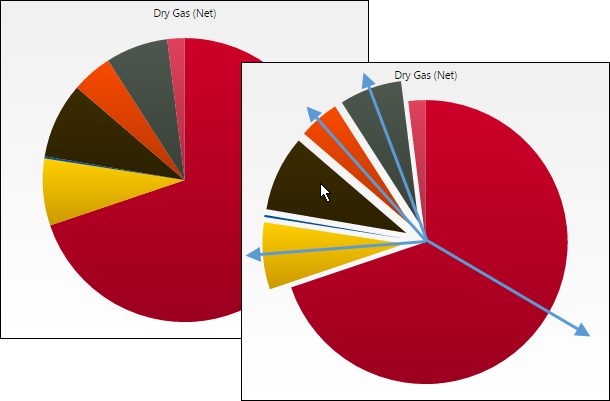
Click image to expand or minimize.
