
As the name suggests, the primary function of the Reporting part of the application is generating reports that can be used to interpret your data. In addition to managing reports, the Reporting part of Reserves will allow you to access context-sensitive modules of the application. In the majority of Reserves deployments, basic users will be able to perform all of their essential tasks using this part of the application.
Accessing the Reporting Part of Reserves
All of the pages discussed in this section can be accessed while using the Reporting part of the application. Select Reporting from the Navigation Toolbar to access the reporting part of Reserves.
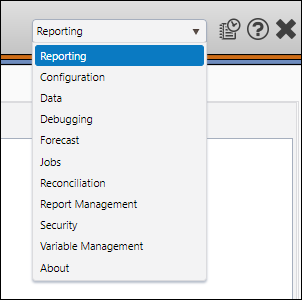
From here, you can access:
- The Report Tab
- The Definitions Tab
- The Data Tab
- The Job Results Page
- The Documents Tab
- The Reconciliation Tab
- The Forecast Tab
The Reporting User Interface
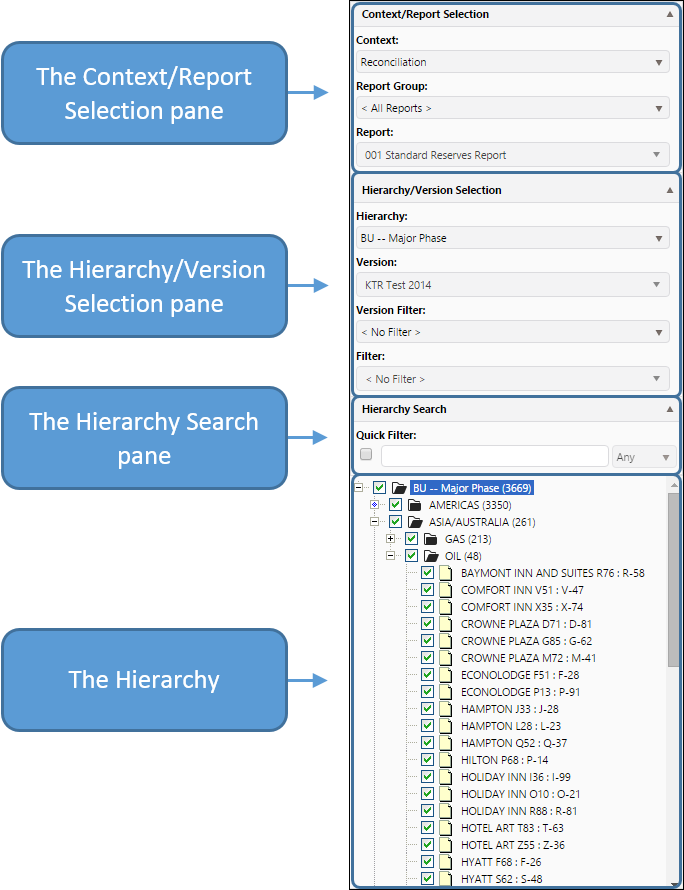
Four elements will be added to the Display pane each time you access a page in the Reporting part of the application (visible below):
Click image to expand or minimize.
The Context/Report Selection Pane
Use the drop-down menus in this pane to set the context in which you want to work, and choose the report you wish to run.
| Context | Select the set of information you want to report on, such as reserves data or economic data. Certain parts of the application are only accessible when using a specific context (e.g. the Current Balance and Production Editor can only be accessed when using your Reconciliation context). |
| Report Group | Select the group of reports that you plan on working with. Selecting a report group will limit the number of reports that can be selected using the Report drop-down menu (described below). Select <All Reports> to deactivate the report group filter. Report Groups can be configured and modified using The Report Groups Page. |
| Report | Select the specific report that contains your target data. This list contains all the reports in the currently selected report group. See The Report Page for more information on running reports. |
The Hierarchy/Version Selection Pane
Use the drop-down menus in this pane to specify the version that contains the data you want to work with, and select a hierarchy to visualize it.
| Hierarchy | Select the hierarchy you want to use to display the data. The hierarchy categorizes all of your data objects according to their attributes. See The Hierarchy below for more information. |
| Version | Select the hierarchy version that contains your target data. |
| Version Filter | Use this option to select a version group. Once a version group is selected, only the versions included in the group will be available for selection using the Version drop-down menu. Selecting the < No Filter > option will deactivate your version filter. Version Filters can be configured and modified using The Version Filters Page. |
| Filter | Use the Filter drop-down menu to activate a group filter or an attribute filter. Both of these filters will hide data objects from the hierarchy, making it easier to limit your reports to a specific subset of your data. When an attribute filter is enabled, only objects that share the attributes defined in the filter will be displayed in the hierarchy. When a group filter is activated, only the data objects that are included in the group will be displayed in the hierarchy. Selecting the < No Filter > option will deactivate the filter option. For more information on group filters and attribute filters, see The Group Filters Page and The Attribute Filters Page, respectively. |
The Hierarchy Search Pane
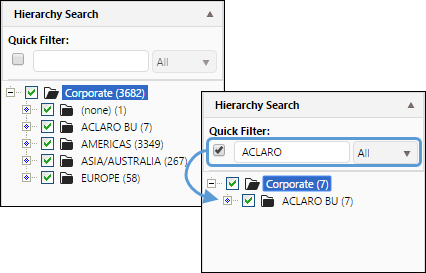
Use the Quick Filter field in the Hierarchy Search pane to quickly locate objects or levels in your hierarchy. If you know where you want to report on in the hierarchy, you can filter directly to it in order to avoid loading extraneous data. Quick Filter will search through both object names, and folder names in your hierarchy.
- Enable the quick filter by toggling the checkbox to the left of the Quick Filter field.
- Enter your search term into the Quick Filter field.
- Press the Enter key.
- Choose Any or All from the drop-down menu to the right of the Quick Filter field.
- Any: Will display results with names that match any parts of your search term.
- All: Will only display results with names that match your search terms exactly.
Objects in the hierarchy will be limited to those that are related to your search term.
The Hierarchy
The hierarchy is used to display all of the data objects that exist in your database, laid out in a fully customizable structure. The hierarchy levels (folders) are called "attributes." Insofar as you have the appropriate permissions, you will be able to create your own custom hierarchies that make use of different attributes in order to produce different views of the same data.
When viewing the Hierarchy:
- The top of the hierarchy is the broadest level of data.
- Each level is a subset of the data until you get to the base unit of data (data object), which can be anything from a well to a unit or PSC, depending on the type of data your company is using.
- Using report options, each level (and selected level) can be calculated as a subtotal.
You can remove levels if they begin to impact navigation.

Click image to expand or minimize.