
Adding Data Table Widgets to Dashboards
To add a data table widget to a dashboard:
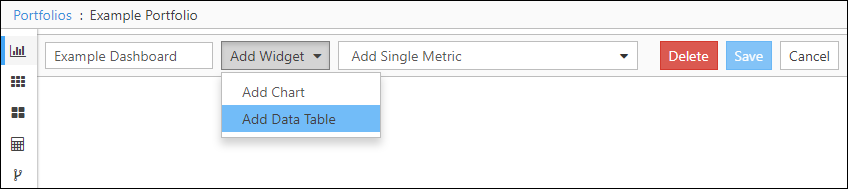
- While editing or creating a dashboard, select Add Data Table using the Add Widgetdrop-down menu. The Data Table Definition window will open.
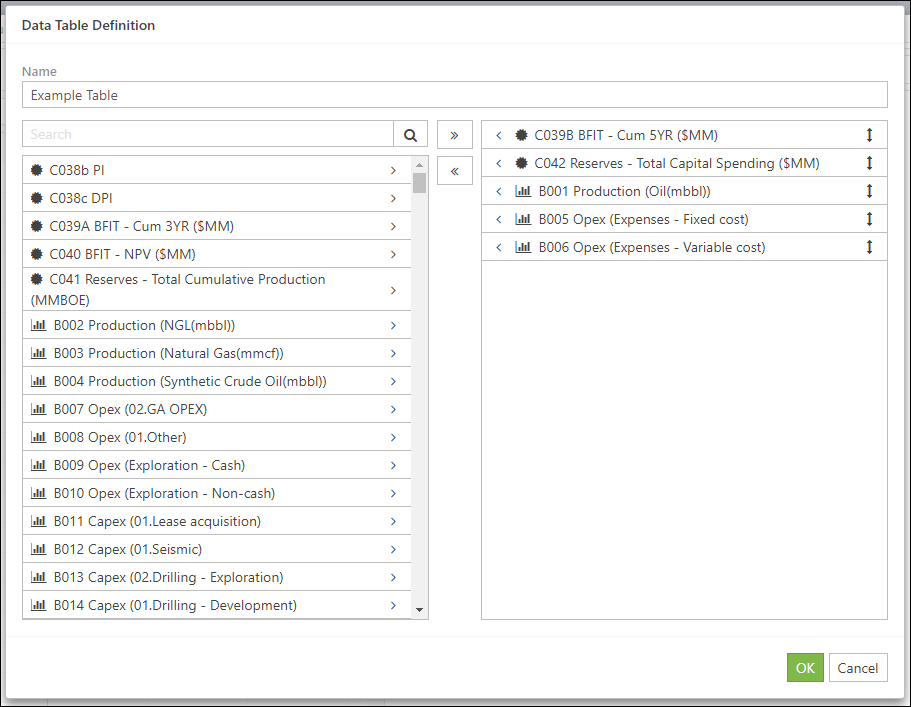
- Set up your table:
- Enter a name for the table in the Name field.
- Select the indicators and metrics to include in the table. Click the Add button (
 ) next to a metric or indicator's name to add it to the table. Click the Add All button (
 ) to add all of the metrics/indicators to the table in one step.
 - To reorder the list of included metrics and indicators, click and hold the Reorder icon (
 ) next to the item you wish to move, and then drag and drop it onto a new position in the list.
 - Click OK to create the chart.
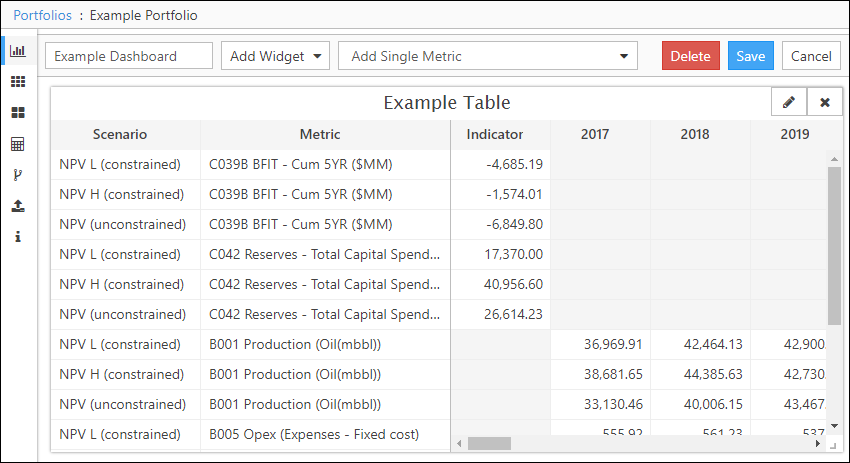
- Resize and reposition the widget, as required.
- Click the Save button to save your dashboard.
Click image to expand or minimize.
Click image to expand or minimize.
Click image to expand or minimize.
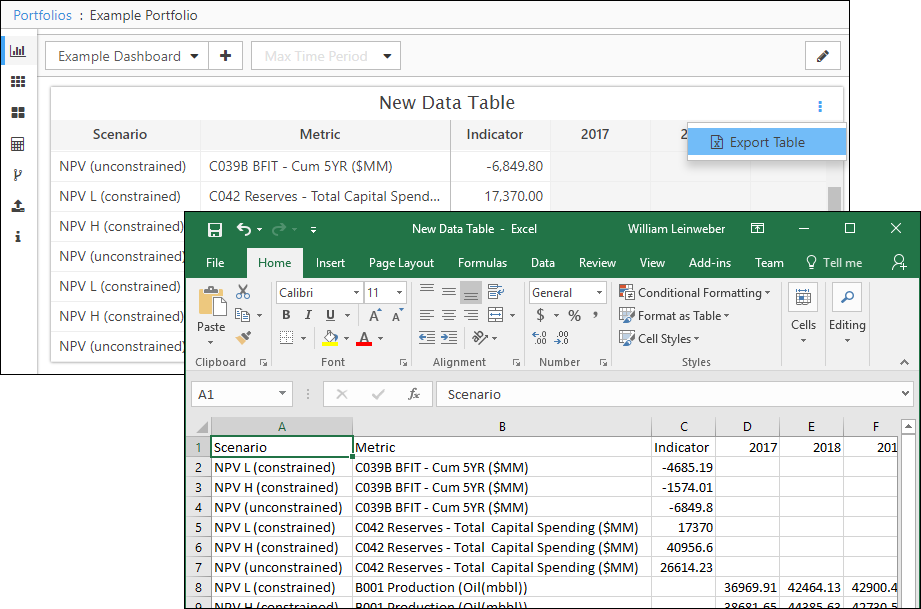
Export Table Widget Data to Excel
To export the data in a table widget to Excel:
- Hover over the table widget you wish to export, and click the Options icon (
 ).
). - Select Export Table.
Click image to expand or minimize.