To add a chart widget to a dashboard
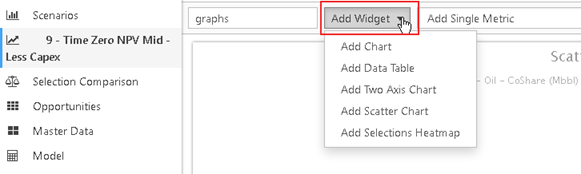
- While editing or creating a dashboard, select Add Chart using the Add Widgetdrop-down menu. The Chart Definition window will open.
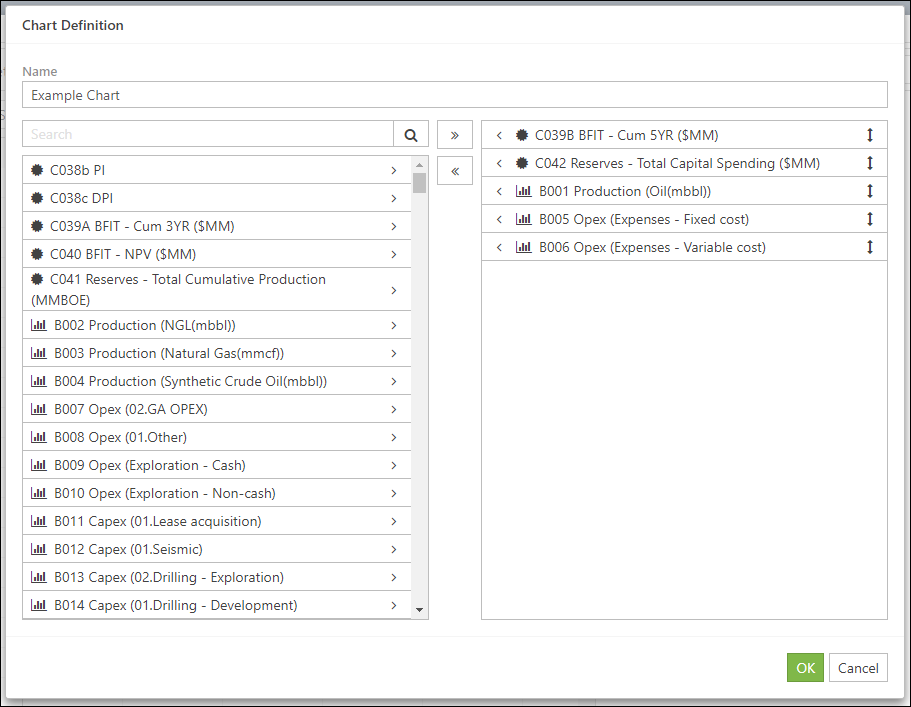
- Set up your chart:
- Enter a name for the chart in the Name field.
- Select the indicators and metrics to include in the chart. Click the Add button next to a metric or indicator's name to add it to the chart.
- Click the Add All button to add all of the metrics/indicators to the chart in one step.
- Click OK to create the chart.
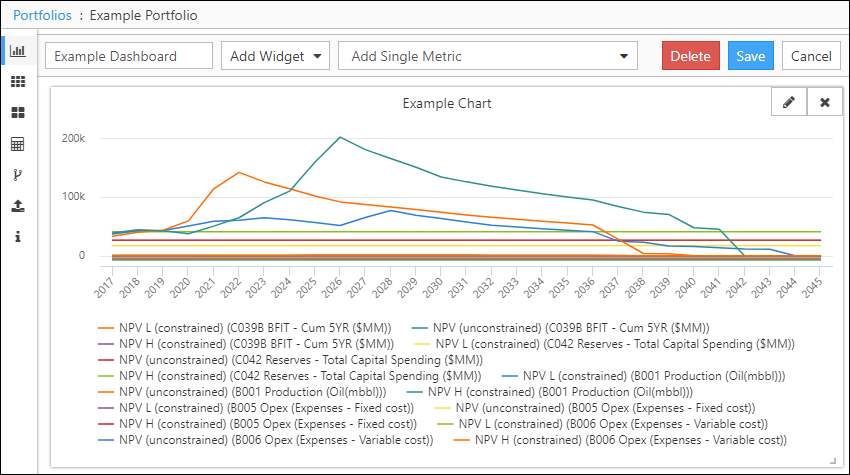
- Resize and reposition the widget, as required.
- Click the Save button to save your dashboard.
Click image to expand or minimize.
Click image to expand or minimize.
Click image to expand or minimize.
Click image to expand or minimize.