
Widgets Overview
You can add widgets to a dashboard from the widget drop-down menu, with multi and single metric widgets available. Use multi-metric widgets to display several data series and single metric charts to show grouped plots or monte carlo ranges and probabilities.
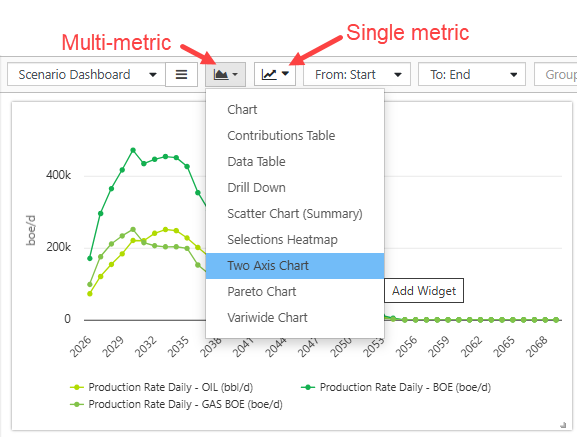
Click image to expand or minimize.
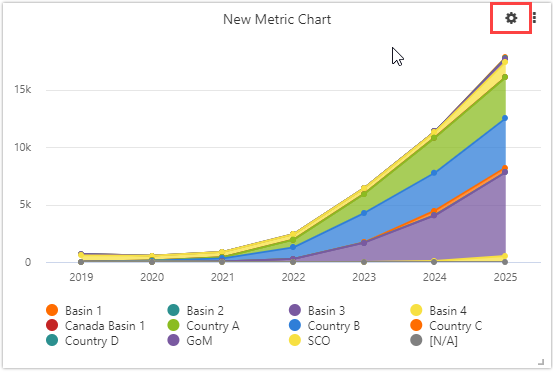
- Configure your widget by choosing the metric(s) to display.
- Use the Appearance tab to set up widget labels, axis scales, and font sizes.
- Hover over an existing widget to see the cog and make changes.
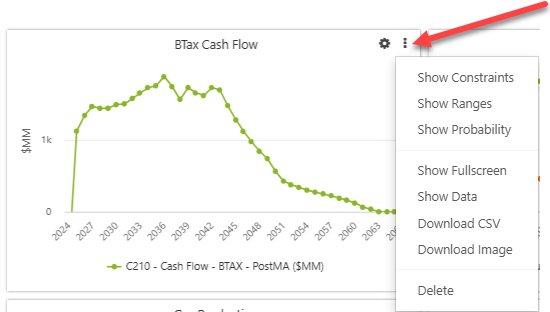
- The three dot menu in the top right corner provides additional options, which vary by widget type. Refer to individual Widget topics for full details. The options may include the following:
- Show Constraints (single metric charts)
- Show Ranges (single metric charts).
- Show Probability (single metric charts). See Monte Carlo for more information
- Show fullscreen: blow the widget up to full size.
- Show data: display underlying chart data
- Download CSV: download the underlying chart data
- Download Image: download the image file
- Delete: delete the widget
Click image to expand or minimize.
Click image to expand or minimize.