The Contributions Table Widget
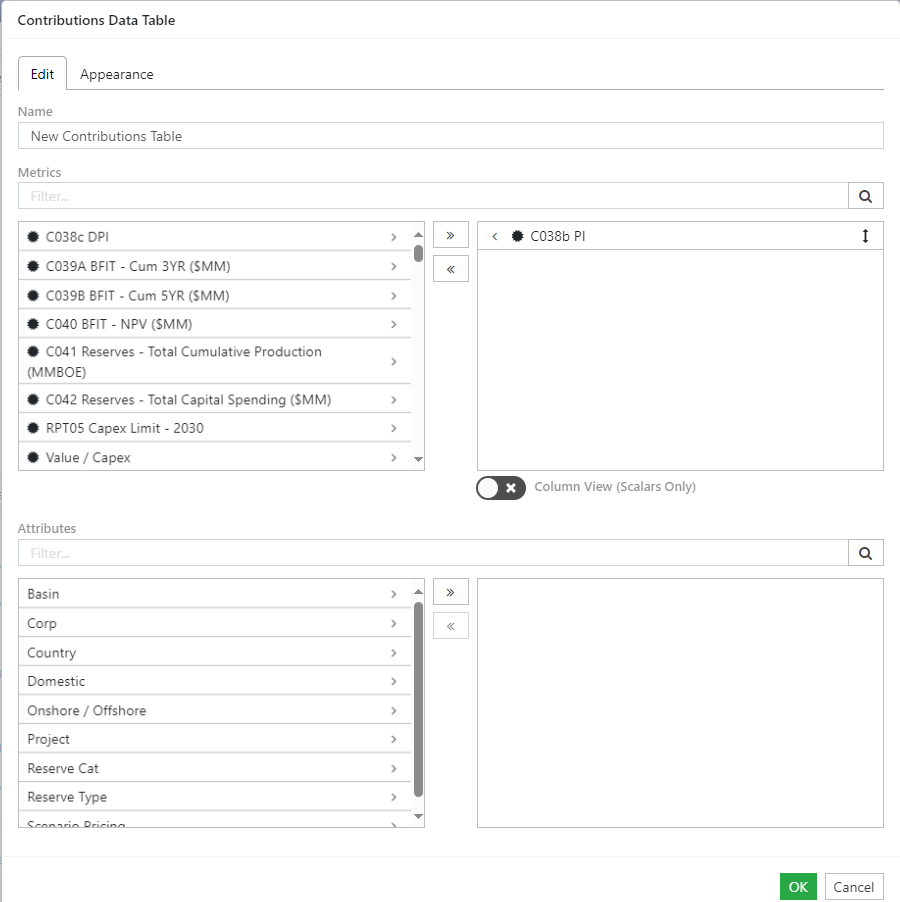
You can add metric and indicator values per Opportunity to a table on your dashboard using the Contributions Data Table widget. Only the Opportunities that are selected in the Scenario are added to the table. See Widgets Overview for information about how to add each widget and additional options.
Adding Contributions Table Widgets to Dashboards
- Set up your table:
- Enter a name for the table in the Name field.
-
Select the indicators and metrics to include in the table. Click the Add button (
 next to a metric or indicator's name to add it to the chart. Click the Add All button (
 ) to add all of the metrics/indicators to the table in one step.
 -
To reorder the list of included metrics and indicators, click and hold the Reorder icon (
 ) next to the item you wish to move, and then drag and drop it onto a new position in the list.
 - Click OK to create the table.
- Resize and reposition the widget, as required.
- Click the Save button to save your dashboard

Click image to expand or minimize.
Column View for Scalars
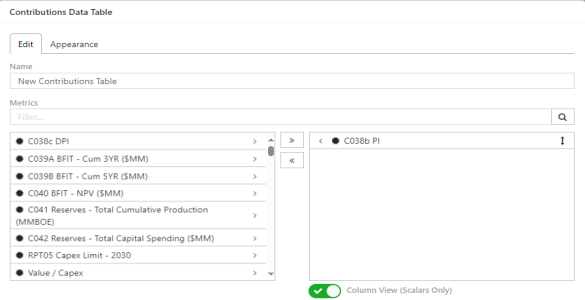
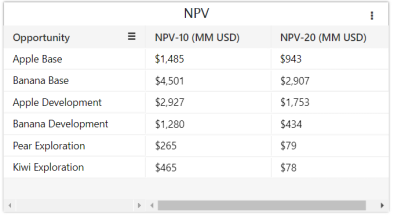
An optional Column View is available for tables that display only scalars (no time series metrics).

The result will display the scalar metrics across columns rather than rows:

Show Metric Level
To view the Metric level (Opportunity, Scenario, etc.) in the dashboard grid
-
Hover over the table widget you wish to modify and click the Options icon (
 ).
).
- Select Show/Hide Metric Level.
The Metric Level is displayed beside the Metric Name.

Click image to expand or minimize.
Export Table Widget Data to Excel
To export the data in a table widget to Excel
-
Hover over the table widget you wish to export and click the Options icon (
 ).
).
- Select Export Table.
The table data is exported to Excel. To support pivot tables, common cell values are unmerged and populated.
