
The Selections Tab
In Portfolio, each selection represents the start of an opportunity. Scenario results are based on the input data shifted and scaled by selections, combined with master data and model calculations. Selections may be generated through optimization. They may also be manually input and adjusted.
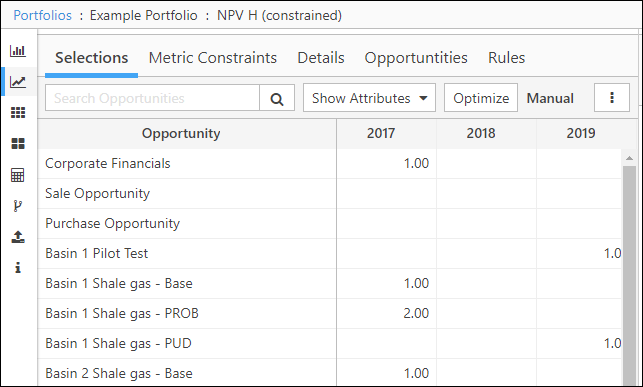
Selections may be viewed and edited using the table in the Selections tab). Each number at the intersection of an opportunity and a date represents how many times the opportunity will start in that time period. For example, in the grid shown below, typing a “1” into the cell at the intersection of “Alpha Base” and “2025” means that any data from The Opportunities Page Overview associated with “Alpha Base” will now begin to contribute to 2025 portfolio totals. If we moved the “1” to “2027,” that data will begin to contribute in 2027 instead. Whenever we manually select or move an opportunity, Portfolio will automatically update the results.
Selections Table Tools
Selection Constraints
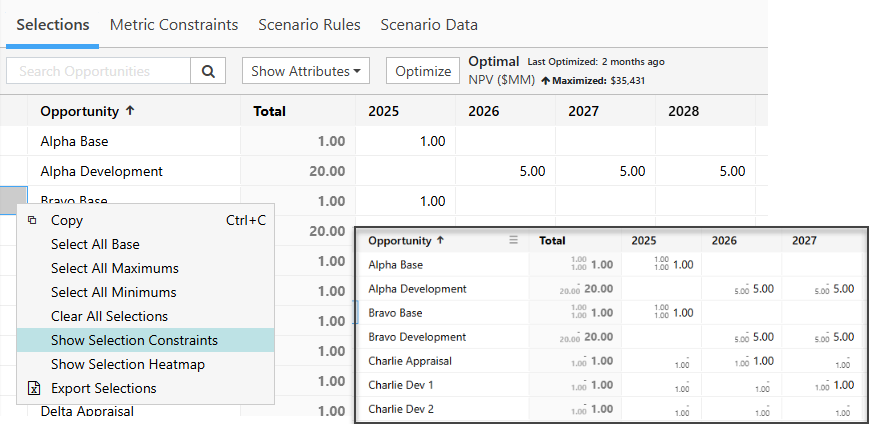
You can display the upper and lower-bound selection constraints (for each opportunity across all periods) in the Selections table by right-clicking on a cell and selecting Show Selection Constraints.
The lower-bound selection constraint will be listed in the upper-left hand corner of each cell; the upper-bound selection constraint will be listed below it.
If an opportunity is part of an active Selection Group with enabled Group Limits, the group selection constraints will be shown. See The Selection Groups Tab.
Click image to expand or minimize.
Selection Heatmap
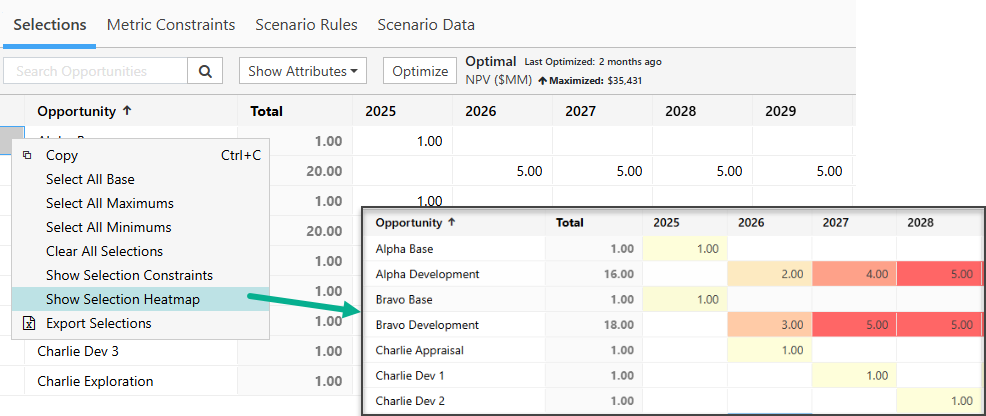
You can add heatmap highlighting to the Selections table by right-clicking on a cell and selecting Show Selection Heatmap.
The largest values in the grid will be highlighted with a darker color; smaller values in the grid will be highlighted with a lighter color.
Click image to expand or minimize.
Manual Selection
Manual selection allows us to start opportunities at any time regardless of constraints or rules. It is useful to:
- Establish and analyze a Base Casescenario, to compare with optimized scenarios.
- Select individual Opportunities in isolation to test specific elements of a model.
- Manually alter an optimized selection as needed to generate a set of results.
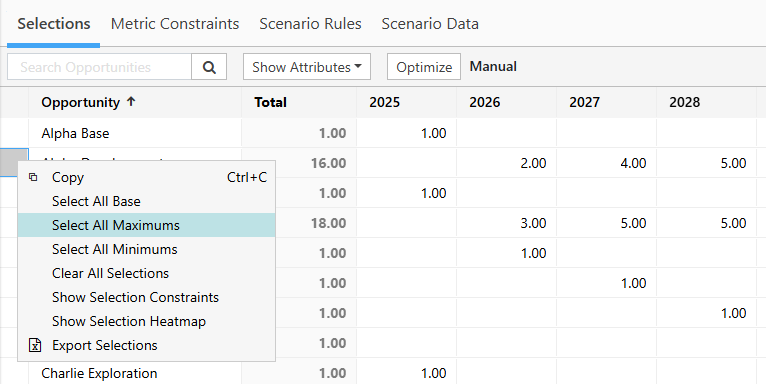
When Opportunities are selected manually, the Scenario’s optimization status will read “Manual” at the top of the grid. Portfolio will calculate results based on the new selections and display them in the Dashboards.
There are several quick manual selection options available using the the vertical three dots menu to the left of each opportunity name. Left click will offer the option to edit selections of each single opportunity, while a right click allows the user to edit all selections in the scenario. The user may set selections to the maximum or minimum allowed, clear selections, or set selections to base (original start time prior to adjustments, refer to Start Period Adjustment):
Click image to expand or minimize.
Optimized Selections
Portfolio was designed to generate selections through optimization. This allows us to build Scenarios that guide the user to the best option, within the constraints and rules of the business.
Portfolio uses a linear programming module to perform optimizations. When solving a linear programming problem, the optimizer will honor constraints while finding the Max or Min by manipulating the selection of Opportunities: choosing or rejecting them, altering ownership percentages, and moving them in time: all within the rules that the modeler enforces.
With a few exceptions, we can optimize any Indicator or single value in a time series Metric in Portfolio. In this context, this Indicator or value is called the Objective Function. When we select our Objective Function, we must also indicate whether that target should be maximized or minimized within the Scenario.
Run an Optimization
To initialize an optimization, follow these steps:
- Click the Optimize button, near the top of the Selections table.
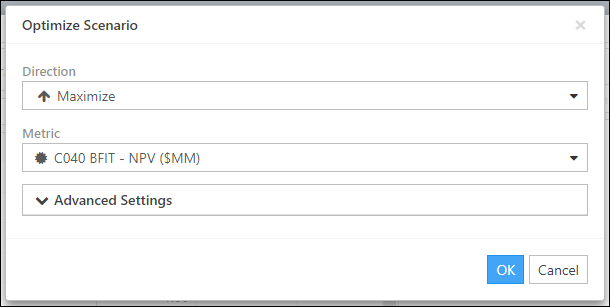
- The Optimize Scenario window will open.
- Select Maximize or Minimize using the Direction drop-down menu.
- Select the metric you wish to maximize or minimize using the Metric drop-down menu.
- (Optional) Expand the Advanced Settings tab and configure any advanced settings you require.
- When you've finished setting up the optimization's settings, click the OK button to initialize the optimization.
Click image to expand or minimize.
Click image to expand or minimize.
When the optimization is complete, the Selections table will be updated. Additionally, a timestamp will be visible next to the Optimize button.
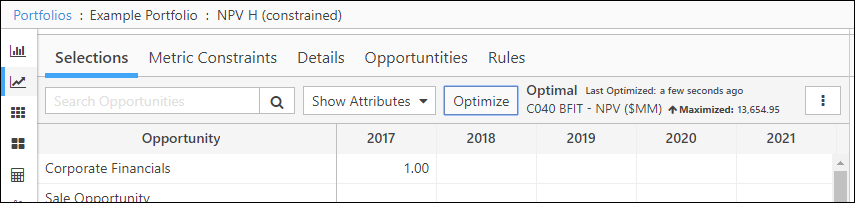
If unsuccessful, it will say “Infeasible”, and the Selections table will be empty. We will discuss optimization in more detail in the Modeling section of this manual.
Optimizer Log
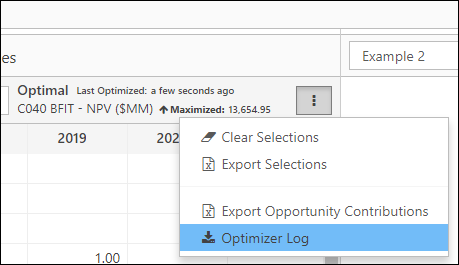
Once an optimization is complete, you can download a log file with detailed information about the optimization. Click the Options icon ( ) near the upper-right corner of the Selections table and select Optimizer Log.
Click image to expand or minimize.
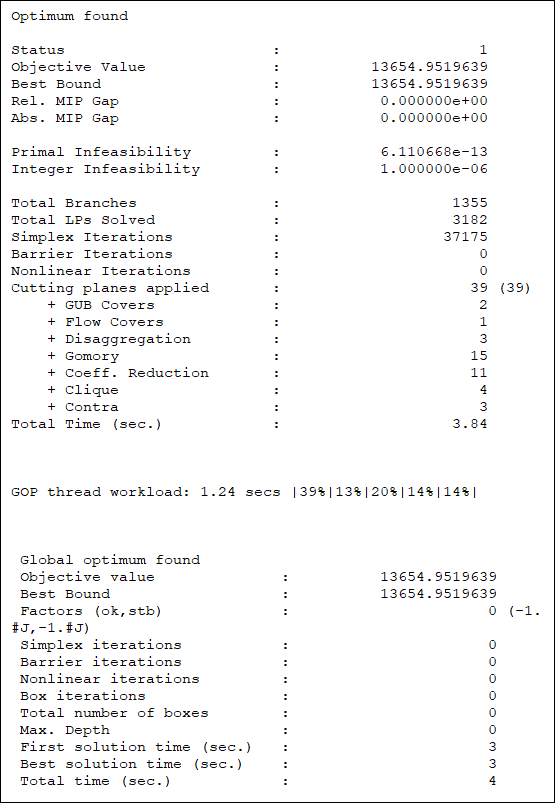
A copy of the optimizer log (a text file with a .log extension) will be downloaded. You can view the contents of this log file using WordPad.
Data from an example optimization log file can be seen below.
Click image to expand or minimize.
Optimization Tips
Some general tips on optimization:
- Keep the initial optimization as open as possible. Set Opportunities to allow for partial selections, not just integers. Additionally, do not initially enforce Metric Constraints.
- After the initial optimization is complete, we can begin to gradually enforce our Constraints, starting with those that are most important to our analysis.
- If some Opportunities are truly binary (integer), enforce them after you are certain that the Scenario can be optimized in continuous, or non-integer, mode.
An incremental approach makes it easier for us to see places in our Scenario where we might not be able to meet our Constraints. Adding Constraints one group at a time also allows us to see if the model can maintain all of its Constraints during an optimization. For example, it may be impossible to meet a 10-year production goal if budgeting Constraints are too strict.
Adding Attributes to the Selections table
By clicking Show Attributes, we can add Attribute columns to our Selections table, allowing us to filter and search our Opportunities.
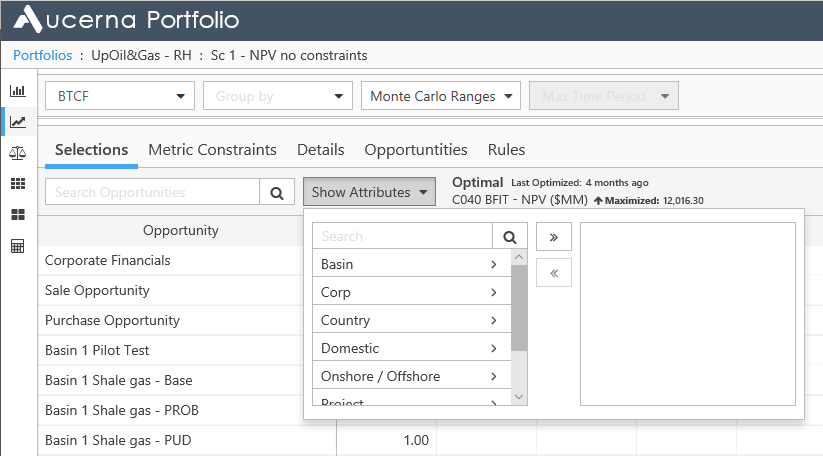
Click image to expand or minimize.
We can filter by Attribute in Scenario view just as we can in Opportunities view, a process that is covered in the “Notes on Filtering” section of this manual.
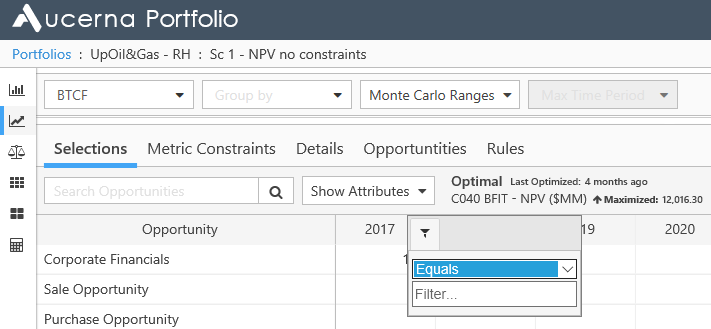
Click image to expand or minimize.
Searching the Selections Table
The Search Opportunities bar above the Selections table does not filter Opportunities. Rather, it highlights the Opportunities in the Selections table that contain the terms we enter, making it quick and easy to search for pertinent information.
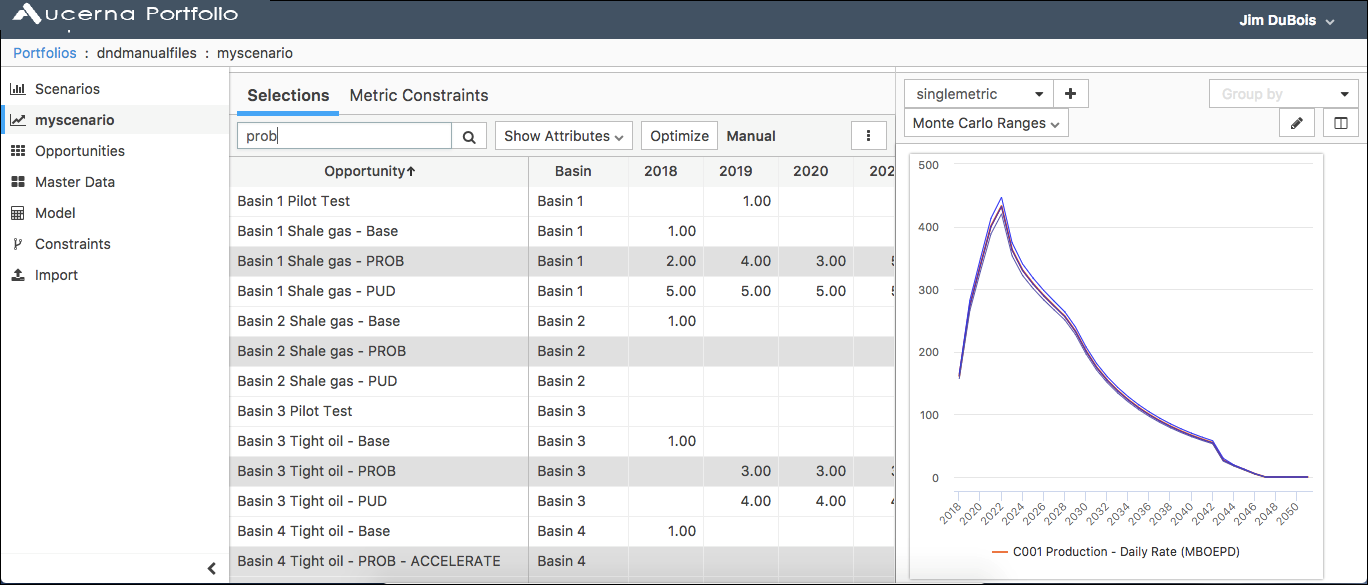
Click image to expand or minimize.
Clearing the Selections table
To clear all of the values in the Selections table, follow these steps:
- Click the Options icon () near the top of the Selections table.
- Select Clear Selections.
- All of the values in the Selections table will be nullified.
Exporting the Selections table
You can export a copy of the data in the Selections table by following these steps:
- Click the Options icon () near the top of the Selections table.
- Select Export Selections.
- A copy of the Selections table will be downloaded.
Exporting Metric Contributions for Selected Opportunities
You can export the metric contributions for selected opportunities in the table into an Excel workbook. The exported workbook (the Metric Contributions Workbook) can be read as a pivot table by business intelligence tools and databases.
Only selected opportunities will be included in the workbook; entities that aren't selected in at least one period won't be listed in the workbook.
Follow these steps to export the metric contributions for selected opportunities in the Selections table:
- Click the Options icon () near the top of the Selections table.
- Select Export Opportunity Contributions.
- When the Export Contribution Levels window opens, set up your export options.
- Select an Opportunity Contribution Level option:
- Select Total to display the total metric contributions for each selected opportunity in the workbook. For example, if an opportunity is selected twice in 2018, and four times in 2021, the sum of its metric contributions for all six of its selections will be listed in a group of rows the workbook.
- Select Selection Period to display per-period metric contributions for each selected opportunity. For example, if an opportunity is selected twice in 2018, and four times in 2021, the sum of its metric contributions for 2018 (two selections) will be listed in one group of rows in the workbook, and the sum of its metric contributions for 2021 (four selections) will be listed in another group of rows in the workbook.
- Select a Display Time Period as option.
- Select Columns to display time periods as columns in the exported workbook.
- Select Rows to display time periods as rows in the exported workbook.
- Select a Metric Type option.
- Select All to include all of the metrics in your scenario in the exported workbook (input metrics, and expression metrics).
- Select Inputs to only include input metric values in the exported workbook.
- Select an Export Destination (visible if an export database is configured)
- Select CSV to export to an Excel workbook.
- Select Database to export to a configured export database.
- Click OK to generate the workbook.
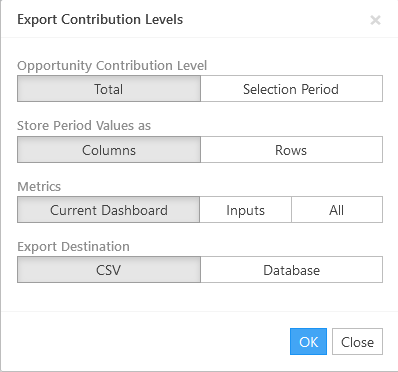
Click image to expand or minimize.
Metric Contributions Workbook
The Metric Contributions workbook will include the following data:
- Opportunity names
- The name of the portfolio that the opportunities were exported from
- The name of the scenario that the opportunities were exported from
- The scenario’s pricing characteristic
- The data version that the opportunities were exported from
- Attribute values for each opportunity (Country, Onshore / Offshore, Basin, Reserve Type, Reserve Cat, Corp, Domestic, Project)
- The metrics in the scenario from which the opportunities were exported. Remember, if the Input Metric Type option was selected when exporting the workbook, only input metrics will be listed in the workbook.
- Metric contributions for each opportunity