
Report Overview
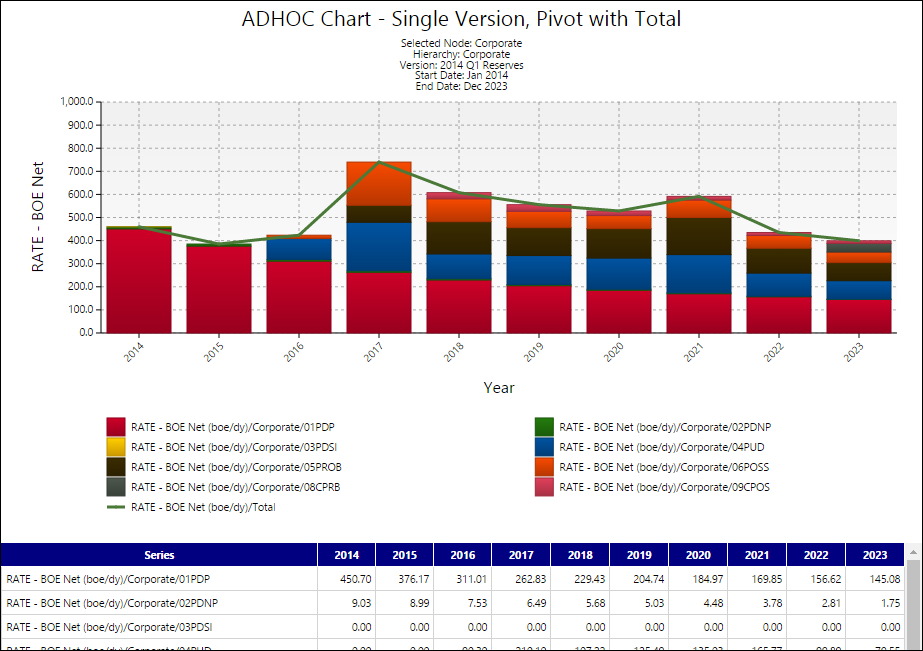
Like the ADHOC Chart - Single Version, Pivot chart, the ADHOC Chart - Single Version, Pivot with Total chart will allow you to pivot the variable values you select against an attribute of your choosing. This chart will also add a total line to each chart corresponding with the sum of each variable's values in each period of the report. In the example below, the total Rate - BOE in each period of the chart is emphasized by the line.
Example Report
Click image to expand or minimize.
Report Options
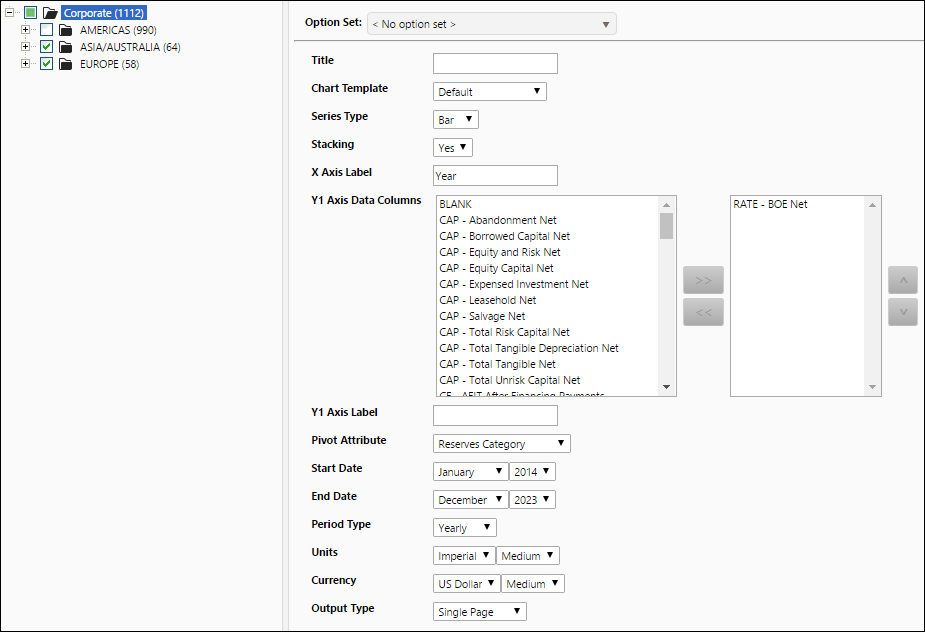
Click image to expand or minimize.