
Report Overview
Like the ADHOC Chart - Single Version report, this report will generate a chart that will allow you to compare your economic variable values within a single version. This report includes also includes the option to pivot the variable values you select against an attribute of your choosing. This chart will allow you to add variables into two different groups. Each group's units are displayed on one of the Y axes of the chart.
Example Report
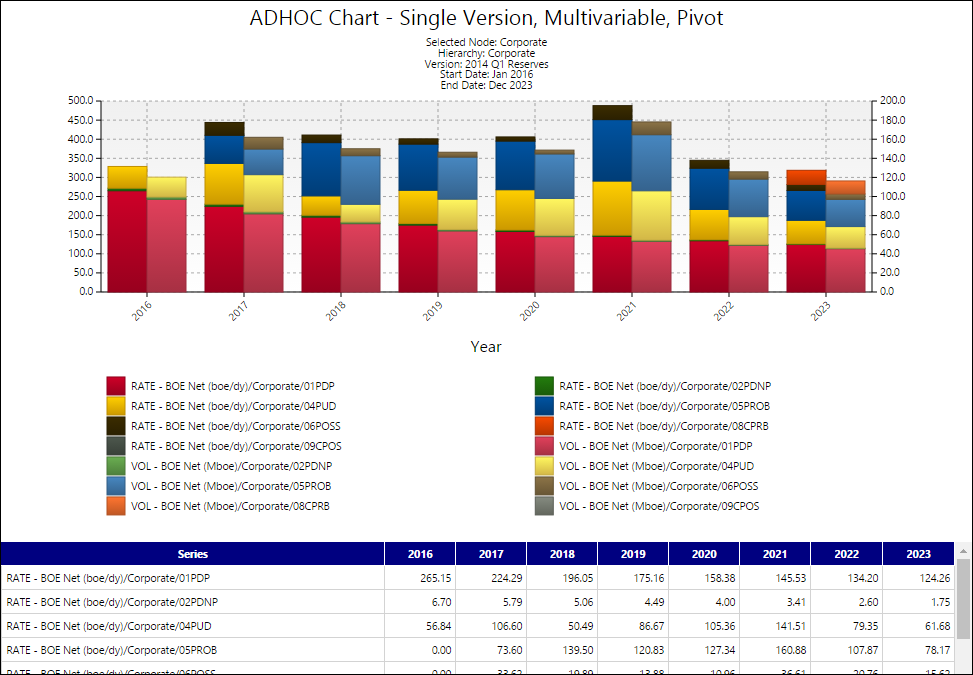
Click image to expand or minimize.
Report Options
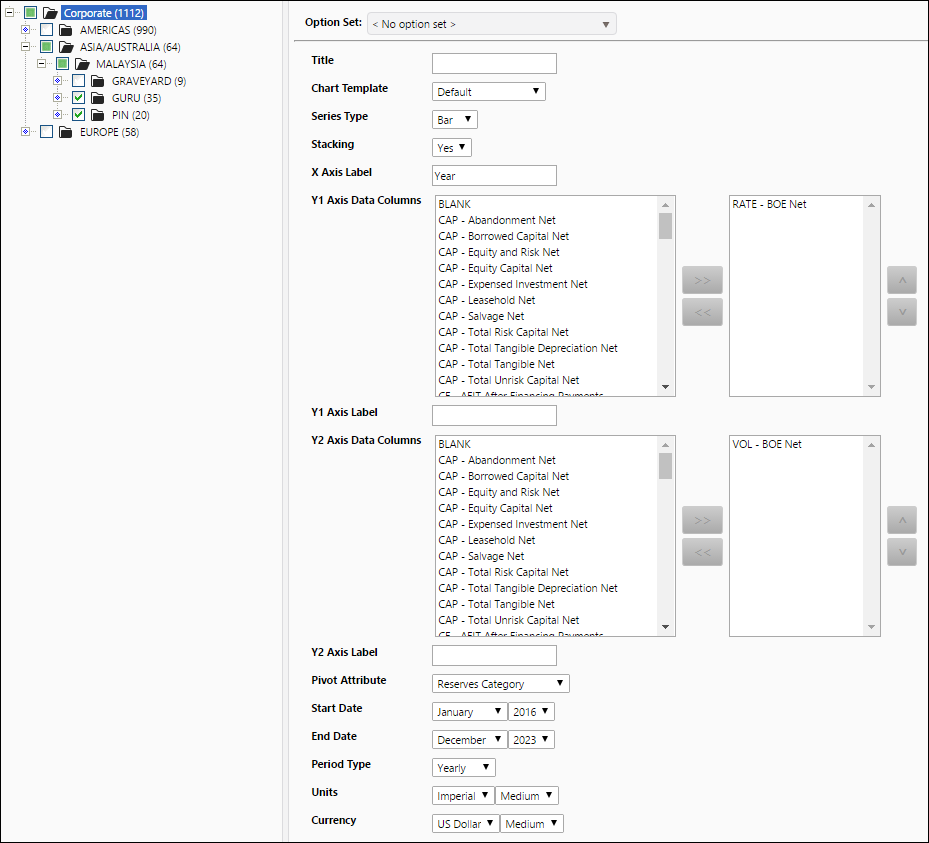
Click image to expand or minimize.