
Report Overview
The Stacked Reserves by Year Chart Report will generate a stacked bar chart that will categorize product volumes by the reserve categories they belong to. Products and reserve categories included in the report are limited to those that are included in the Product Group and Reserve Category Group you select for the report. A separate chart will be created for each product included in the report. Using the report's options, you'll be able to add up to 9 versions to your report.
Bar charts created with Reserves's reporting engine are interactive. For more information, see Working with Charts.
Example Report
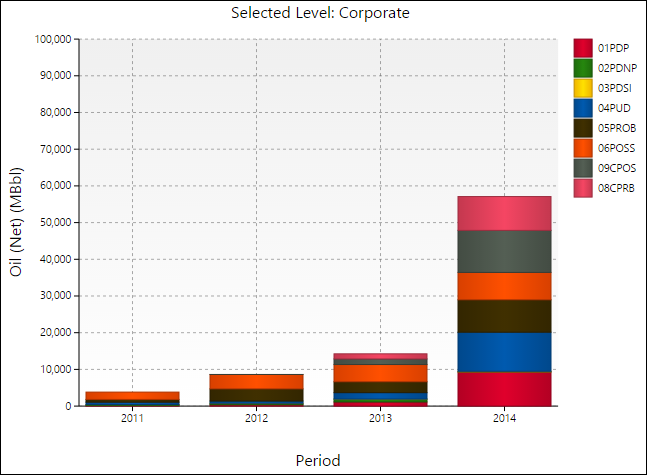
Click image to expand or minimize.
Report Options
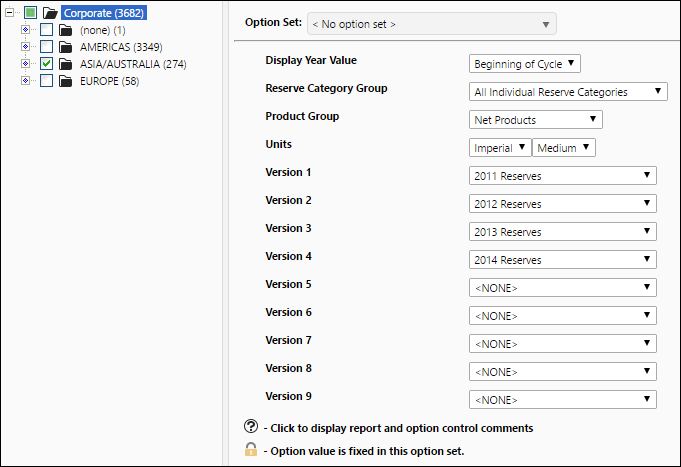
Click image to expand or minimize.