
Report Overview
Use the Multi Year Waterfall Chart report to generate a chart that will allow you to visualize the growth of your reserves over time, based on the Reserve Category Group, Change Category Group and Product Group you select for the report. The chart created by this report will show the opening balance for the earliest time period selected for the report, positive changes and adjustments, negative changes and adjustments, a production value, and your closing balance. Closing balances are then used as opening balances for subsequent versions.
Bar charts created with Reserves's reporting engine are interactive. For more information, see Working with Charts.
Example Report
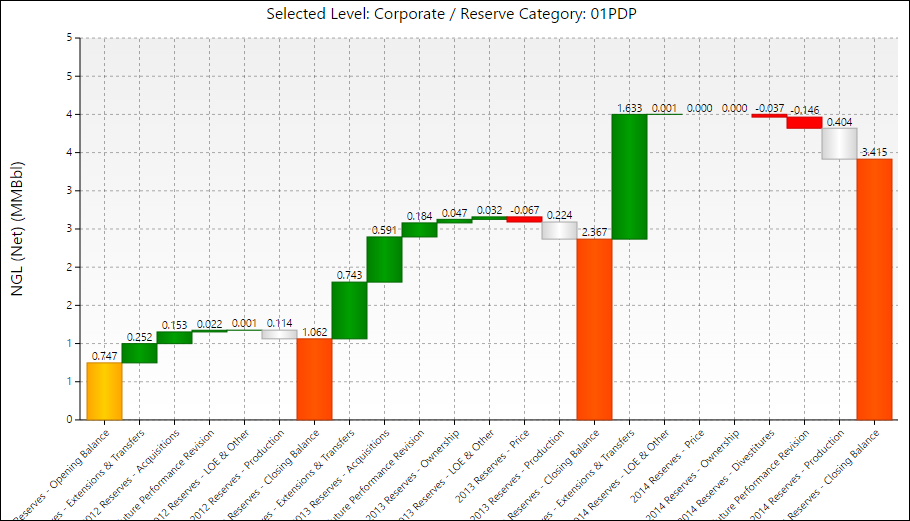
Click image to expand or minimize.
Report Options
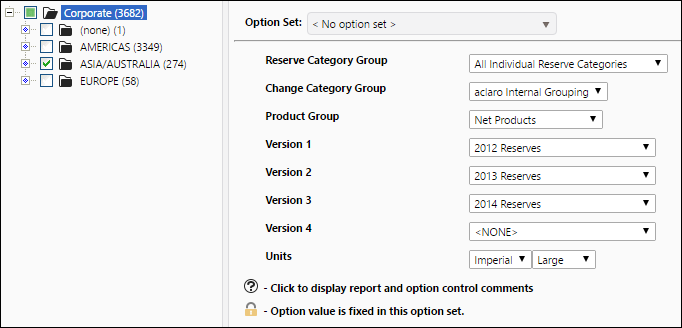
Click image to expand or minimize.