Report Overview
Use this report to generate a series of bar charts that will help you visualize the relationship between your Opening balance, Adjustments, and Closing balance for all of the objects you select from your hierarchy, for up to 9 versions. The resulting charts are based on the Reserve Category Group, Change Category Group, and Product group you choose to run the report. A separate chart will be created for each reserve category/product type combination available.
- If you select a change category group with multiple change types, additional columns will be added to the chart, and divide changes accordingly.
- You'll be able to hide or display the opening balance, change categories, or closing balance using the report's options.
Bar charts created with Reserves's reporting engine are interactive. For more information, see Working with Charts.
Example Report
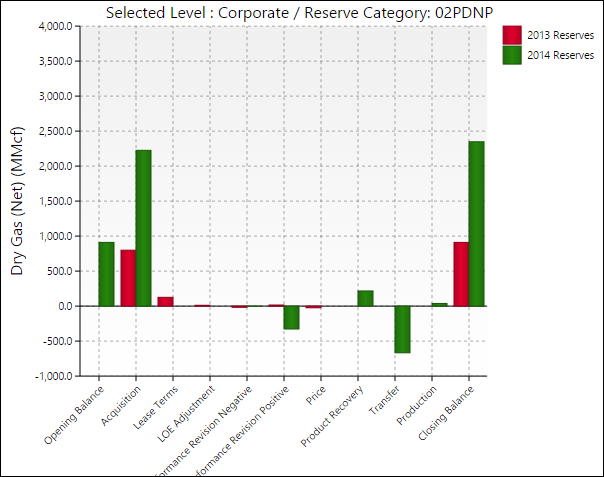
Click image to expand or minimize.
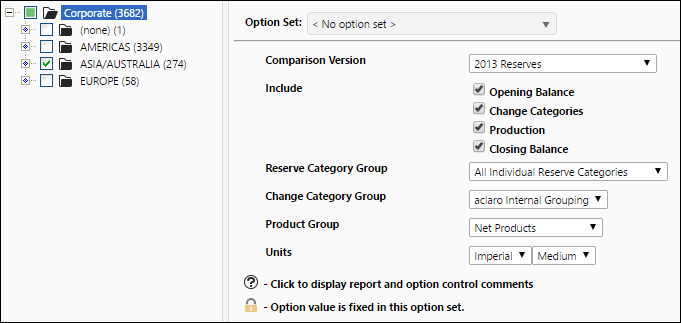
Report Options