Report Overview
Use the Reserve Pie Chart Report to visualize how fractions of your resources are divided between reserve categories for the objects you select for the report. The Reserve Pie Chart report will generate a series of pie charts, each corresponding with a product from the Product Group you select to run the report. Charts will be created to represent each product/opening balance and product/closing balance pair included in the report. Segments of the pie charts will be color-coded, and each color will correspond with a different reserve category.
Pie charts created using Reserves's reporting engine are interactive. For information on pie charts, see Working with Charts.
Example Report
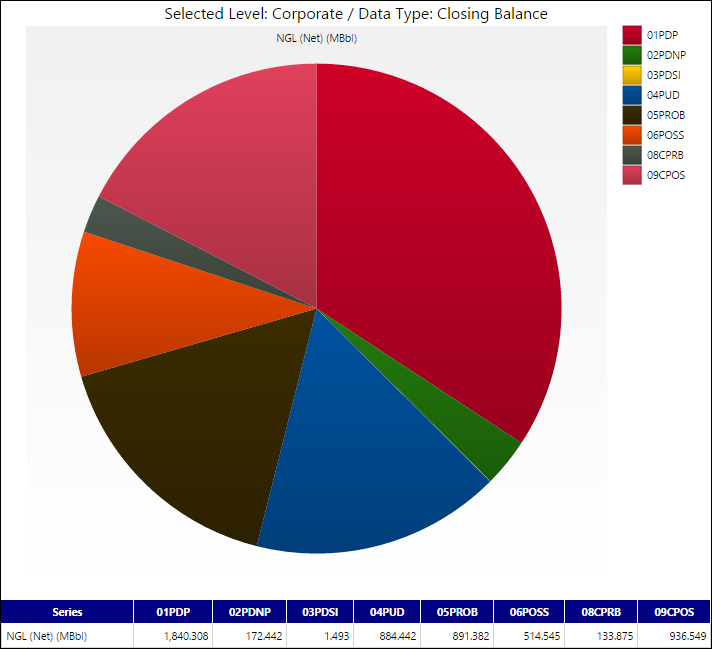
Click image to expand or minimize.
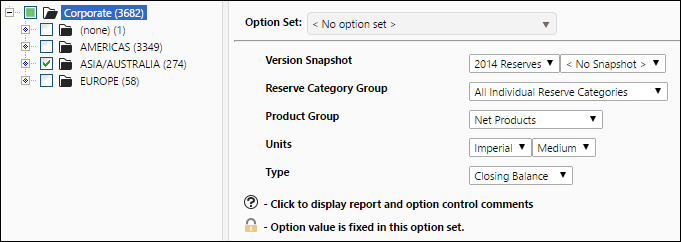
Report Options