Report Overview
Use the Change Record Pie Chart report to create a series of pie charts that will help you visualize the ratio of adjustments that have been made for the objects you select from your hierarchy, based on the Reserve Category, Change Category, and Product groups you choose to run the report. The table generated by this report will show:
- The ratio of one adjustment type, as compared with the other adjustments included in the change category group you select to run the report.
- This report will create a pie chart for each product/reserve category pair included in the report.
- Different segments of the pie charts will correspond with different products included in the product group you select for the report.
Pie charts created by this report are interactive. For information on pie charts, see Working with Charts.
Example Report
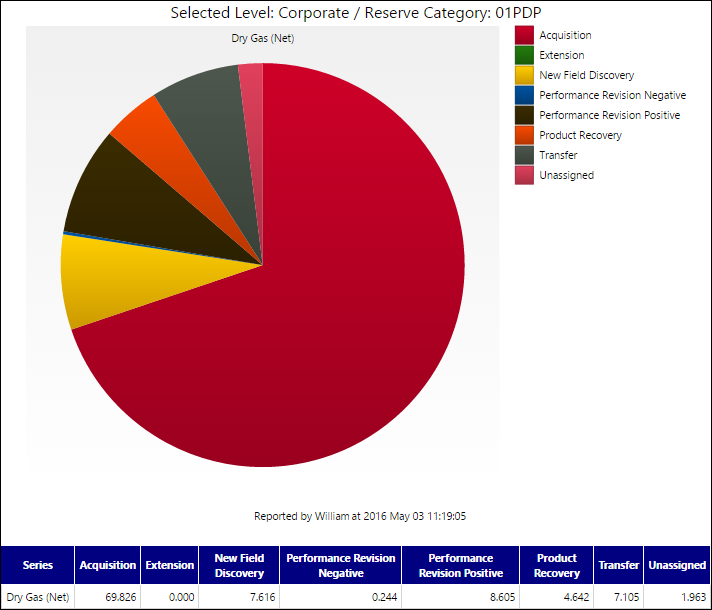
Click image to expand or minimize.
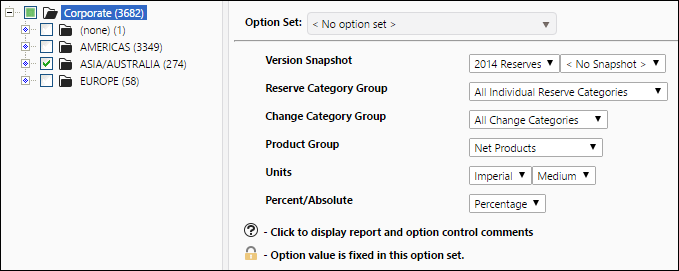
Report Options