
Report Overview
Use this report to create a series of bar charts that will help you visualize changes in your reserves volumes (closing balances) between versions. Only the products that are included in the Product Group you select for the report will be displayed on your charts. A table will be created for each reserve category in the Reserve Category Group you selected for the report. Using the report's options, you will be able to select up to 9 versions to compare.
Bar charts created with Reserves's reporting engine are interactive. For more information, see Working with Charts.
Example Report
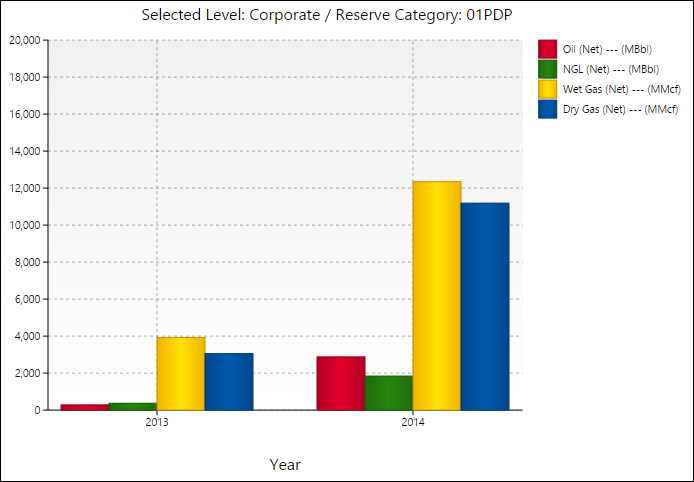
Click image to expand or minimize.
Report Options
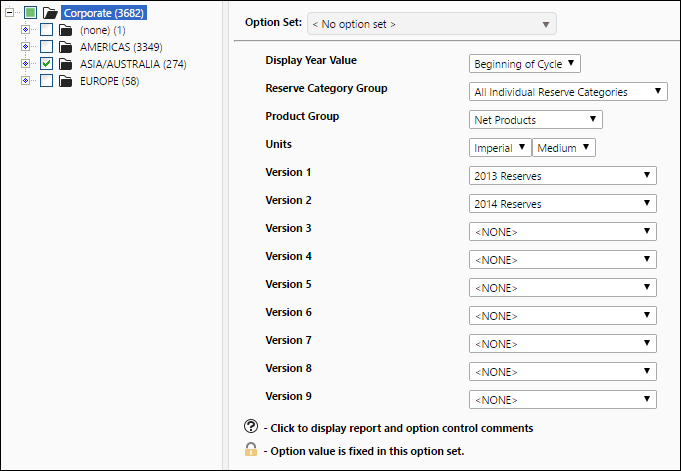
Click image to expand or minimize.