Report Overview
Use the Waterfall Chart Report to generate a series of waterfall charts. These will allow you to visualize how your opening balance and various changes amount to your closing balance. Charts will vary based on the Reserve Category, Product, and Change Category groups you select to run the report.
- A table will be created for each reserve category/product pair included in the report.
- Each change category type (included in the change category group selected for the report) will be represented on the table. Positive changes are displayed towards the left-hand side of the chart and negative changes are displayed toward the right-hand side of the chart.
Bar charts created with Reserves's reporting engine are interactive. For more information, see Working with Charts.
Example Report
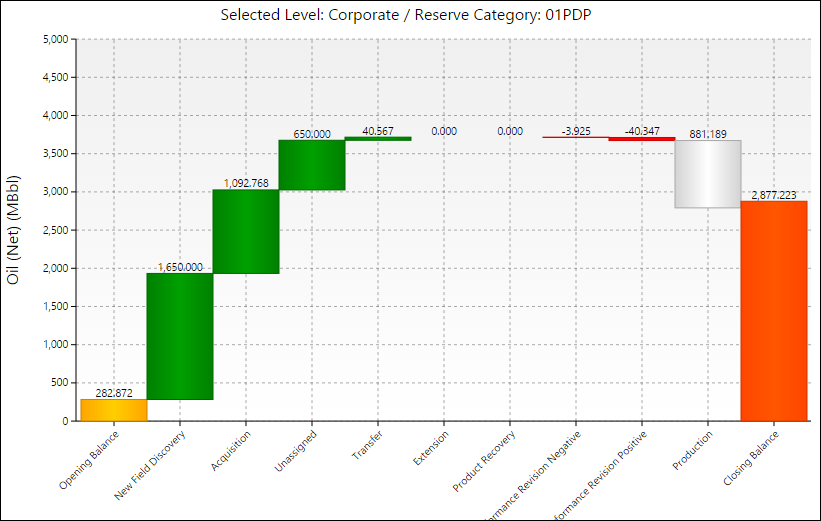
Click image to expand or minimize.
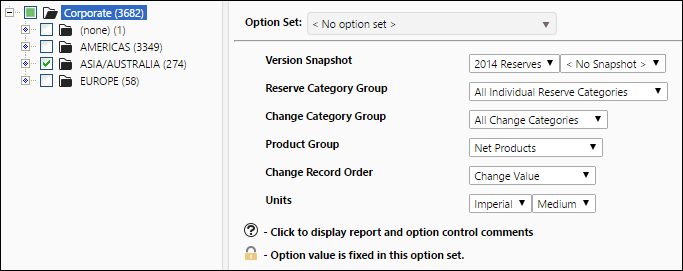
Report Options