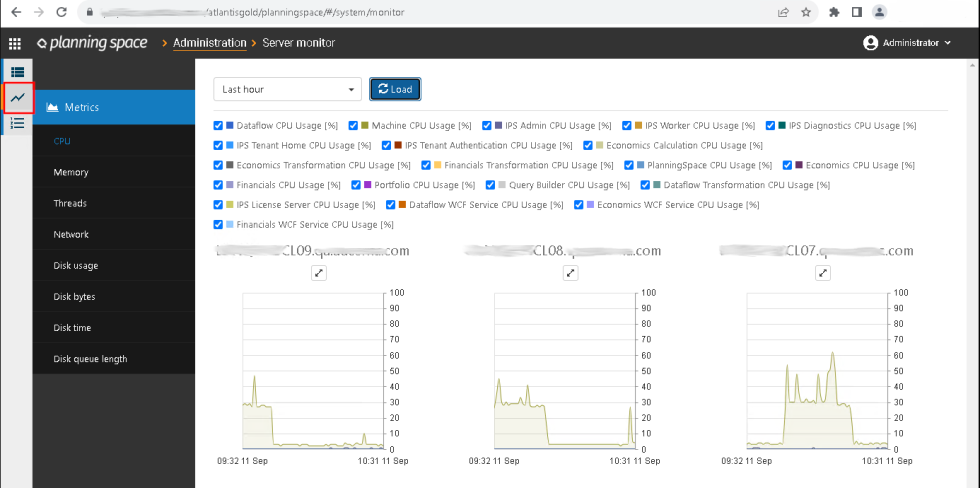
IPS Server Monitor
IPS Server machines
Planning Space is deployed on one or several Windows server machines, which may be physical servers or virtual machines.
Tenant users' logon sessions and scheduled jobs will be distributed across server machines according to the configuration set up by the Planning Space Aministrator. Please contact your Administrator for current information about the server machines in your deployment.
IPS Server Monitor is a graphical web-based interface to access live and historical performance data for the IPS Server machines in a deployment.
Note: The IPS service setting 'Enable Server Monitor' (with enabled as the default setting) can be used to disable all server monitor processes. When it is disabled, all back-end data collection and API endpoints will be stopped; and the tenant Server Monitor user interface will be removed.
Access to IPS Server Monitor
In the Planning Space Web interface, open the Administration screen and select Server Monitor in the left-hand menu.
Note: The Administration screen in Planning Space Web requires login as a an Administrator user.

Or you can use the direct URL 'https://{SERVICEADDRESS}/{TENANTNAME}/#/system/monitor'.
In the Planning Space Desktop Client application, running on your own client machine, you can select Server Monitor in the top menu in the Administration workspace.
Using IPS Server Monitor
There is a graph view for each IPS Server machine. The machine name appears above the graph view.
Note: Graph views do not appear for server machines that are not in a Running state.
Click the expand
icon ![]() on any graph to get an expanded view
(and click the X icon to close it).
on any graph to get an expanded view
(and click the X icon to close it).
The coloured bars located at the right of each graph show the current values of the performance metrics, for each server machine.
You can select which performance metrics are displayed by clicking the metric category in the left-hand menu ('CPU', 'Memory', 'Threads', and so on). The table below shows all of the performance metrics that are available.
Each graph shows historical data for the time range as selected by the drop-down menu at the top left, ranging from the last 15 minutes to 24 hours, or a custom time range. Click the Load button to load the new data into the graphs.
The number of days of stored performance data is 30 days by default, with a sampling interval of 30 seconds. Check with your Planning Space Administrator about the data settings for your deployment.
The key to the graphs appears above the graphs, indicating the metrics that are displayed.
Use the tick boxes in the key to show or hide the graph data for individual metrics:

Table of metrics
Note: if the IPS Server is running additional add-in services then application metric data will be shown for the additional services.
| Metric category | Machine metrics | IPS server usage metrics | Application usage metrics |
|---|---|---|---|
| CPU | Machine CPU Usage (%) |
IPS Admin CPU Usage (%)
IPS Diagnostics CPU Usage (%)
IPS License Server CPU Usage (%)
IPS Tenant Authentication CPU Usage (%)
IPS Tenant Home CPU Usage (%)
IPS Worker CPU Usage (%)
|
Dataflow CPU Usage (%)
Dataflow Transformation CPU Usage (%)
Dataflow WCF Service CPU Usage (%)
Economics Calculation CPU Usage (%)
Economics CPU Usage (%)
Economics Transformation CPU Usage (%)
Economics WCF Service CPU Usage (%)
Financials CPU Usage (%)
Financials Transformation CPU Usage (%)
Financials WCF Service CPU Usage (%)
PlanningSpace CPU Usage (%)
Portfolio CPU Usage (%)
Query Builder CPU Usage (%)
|
| Memory | Machine Memory Usage (MB) |
IPS Admin Memory Usage (MB)
IPS Diagnostics Memory Usage (MB)
IPS License Server Memory Usage (MB)
IPS Tenant Authentication Memory Usage (MB)
IPS Tenant Home Memory Usage (MB)
IPS Worker Memory Usage (MB)
|
Dataflow Memory Usage (MB)
Dataflow Transformation Memory Usage (MB)
Dataflow WCF Service Memory Usage (MB)
Economics Calculation Memory Usage (MB)
Economics Memory Usage (MB)
Economics Transformation Memory Usage (MB)
Economics WCF Service Memory Usage (MB)
Financials Memory Usage (MB)
Financials Transformation Memory Usage (MB)
Financials WCF Service Memory Usage (MB)
PlanningSpace Memory Usage (MB)
Portfolio Memory Usage (MB)
Query Builder Memory Usage (MB)
|
| Threads | Machine Thread Usage |
IPS Admin Thread Usage
IPS License Server Thread Usage
IPS Diagnostics Thread Usage
IPS Tenant Authentication Thread Usage
IPS Tenant Home Thread Usage
IPS Worker Thread Usage
|
Dataflow Thread Usage
Dataflow Transformation Thread Usage
Dataflow WCF Service Thread Usage
Economics Calculation Thread Usage
Economics Thread Usage
Economics Transformation Thread Usage
Economics WCF Service Thread Usage
Financials Thread Usage
Financials Transformation Thread Usage
Financials WCF Service Thread Usage
PlanningSpace Thread Usage
Portfolio Thread Usage
Query Builder Thread Usage
|
| Network | Network Usage (Kbps) | ||
| Disk usage |
Disk Read Time (%)
Disk Time (%)
Disk Write Time (%)
Free Space (%)
Idle Time (%)
|
||
| Disk bytes |
Average Disk Bytes/Read (Kb)
Average Disk Bytes/Write (Kb)
Average Disk Bytes/Transfer (Kb)
|
||
| Disk time |
Average Disk sec/Read (Milliseconds)
Average Disk sec/Write (Milliseconds)
Average Disk sec/Transfer (Milliseconds)
|
||
| Disk queue length |
Average Disk Queue Length
Average Disk Read Queue Length
Average Disk Write Queue Length
|
