Add data series
To add a new data series to a chart, right-click in the chart and select the Properties option. In the Properties window, open the Series tab.
The Series tab contains several sections which determine what is displayed on the chart. If you have several data series, the Appearance and Series Data sections will show settings for the selected series. The order of the series determines their position on the chart: the series at the bottom of the list is displayed on top.

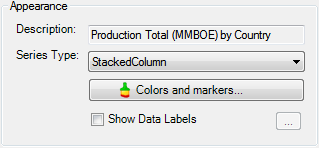
The fields in the Appearance section are explained in the table below.

| Field | Description |
|---|---|
| Description | Shows the name of the displayed variable and the type of project grouping. This field is automatically updated when you specify the settings in the Series Data section. |
| Series Type | Controls which chart type is used to display the selected series. |
| Colors and Markers | Opens the chart color settings (see Edit colors). |
| Show Data Labels | Displays or hides labels for data points. If you check this box, the selection button next to it will become active; click the button to set up data series labels (see Set up data series labels). |
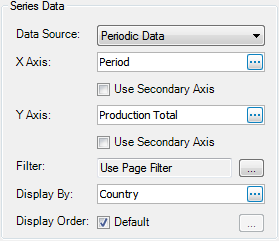
The fields in the Series Data section are explained in the table below.

| Field | Description |
|---|---|
| Data Source | Select whether periodic or summary variables from the current portfolio or snapshots will be displayed on the chart. Summary variables can be used as benchmarks or to compare actual values with targets. |
| X Axis | Select the value to be displayed along the X axis by clicking
the ellipsis button  . To display the time line, select the Period option. . To display the time line, select the Period option. |
| Y Axis | Select the value to be displayed along the Y axis by clicking
the ellipsis button  . To display the time line, select the Period option. . To display the time line, select the Period option. |
| Use Secondary Axis | Check this box to add another axis to the chart. |
| Filter | Click the ellipsis button
 to create custom filters
(see Filter data). When a filter is applied to a data series,
the filter icon to create custom filters
(see Filter data). When a filter is applied to a data series,
the filter icon  will be displayed in the top right corner of the chart. will be displayed in the top right corner of the chart. |
| Display By | Group displayed values based on various parameters. The Projects View setting arranges projects on the chart in the way they are displayed in the Projects View, with all filters and groupings. Project Name displays projects with their individual colors. Project Type displays projects using the color of the type they belong to. |
| Display Order | The order in which projects are displayed on the chart. To change the order,
uncheck the Default box, click the ellipsis  button, and move projects up or down in the pop-up dialog. button, and move projects up or down in the pop-up dialog. |