GA Optimization results
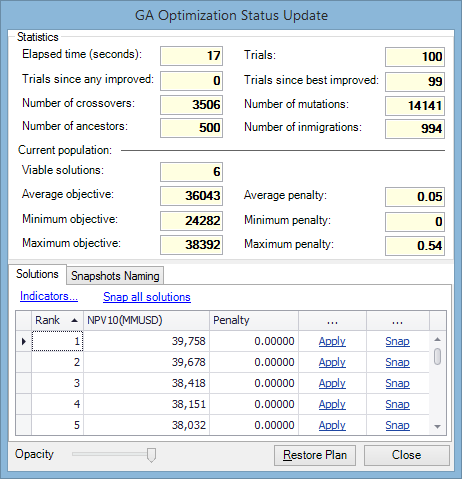
When optimization is finished, a dialog like the one shown below will be displayed.

The Statistics section shows information about the finished run. This information, combined with optimization results, can be used to find better settings for another run.
The Solutions tab contains information about the best solutions found by the algorithm. Here you can view indicator values and save solutions as snapshots. The solutions are sorted first by penalty (from lowest to highest) and then by optimization indicator values (beginning with the best matches).
To view a solution, click the Apply button next to it. The Projects View and the charts will be updated with values from that solution. To return to the original portfolio, click the Restore Plan button.
To view indicators, click the Indicators link and check the box next to the indicator's name in the pop-up window. A column with values for this indicator will be added to the table. You can add as many indicators as required.
To save an individual solution as a snapshot, click the Snap link next to it. To save all solutions as snapshots, click the Snap all solutions button. The Snapshots Naming tab is used to define how the snapshots will be named (see the table below).
| Field | Description |
|---|---|
| User Field 1 and User Field 2 | Text fields where you can specify a naming element not present on the list. For example, here you can enter the purpose of the analysis to make snapshot names more meaningful. |
| Rank | Portfolio's position based on optimization results (always included). |
| Optimization Indicator Name | This setting is taken from the corresponding field on the Model Definition tab. |
| Optimization Goal | This setting is taken from the corresponding field on the Model Definition tab. |
| Optimization Indicator Value | The calculated value of the optimization indicator specified on the Model Definition tab. |
| Sample Path | Shows what the snapshot name will look like. |
The slider at the bottom changes the window's transparency. By making the window transparent, you can view a solution and apply a different solution if you do not like the results.