Charts
The Visualization tab contains a chart which shows the distribution of changes for each product
type in a node. Two types of charts are available: column and waterfall; you can change the chart type by clicking the Column
button  or Waterfall
button
  on the ribbon.
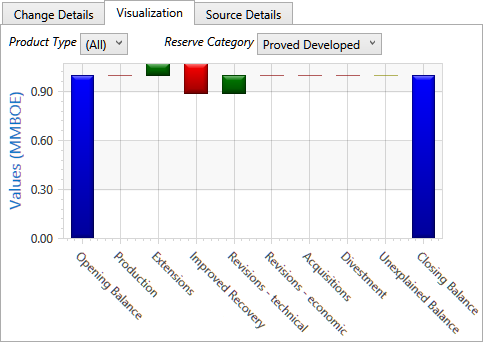
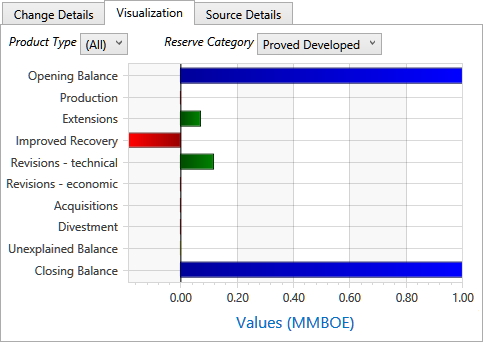
Chart colors are fixed: opening and closing balances are blue, unexplained balance is yellow, other positive balances are green, and negative balances are red. The chart is automatically updated when you edit values in the Change Records table.
By default, the chart shows data for all products and for the first available reserve category. When you click cells in the Change Records table, the chart will automatically display data for the selected product and category. To view a particular product or category, select new values in the Product Type and Reserve Category fields.
An example of a waterfall chart is shown below.

An example of a column chart is shown below.

