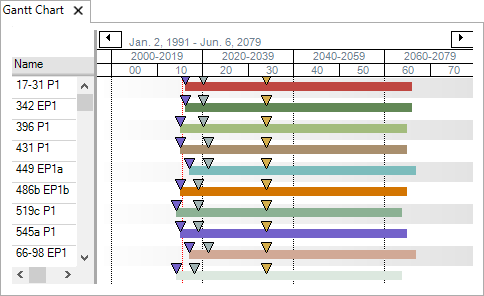
Gantt Chart
The Gantt Chart tab displays the project duration and is used to visualize project shifting. To open it, use the Show/Hide button
 on the ribbon.
The chart contains only those projects that are included into the portfolio, and it is updated automatically when you exclude or include projects.

On this chart, projects are represented by colored bars. Initially, the colors are assigned randomly, but you can change the color by double-clicking the project bar and selecting a new color in the Color Picker dialog.
Colored arrows represent project dependencies. To change the color, click the arrow and select the new color in the pop-up window. For more information, see Project dependencies.
The panel at the top contains the dates when the displayed period starts and ends, and arrow buttons for navigating the timeline. The ribbon buttons are explained in the table below; the same options are available from the context menu when you right-click the chart.
| Button | Description |
|---|---|

|
Opens a list of chart start options, for example,Project Start Year, First Production, First Capital or First Non-Zero Date (the first date for which there are data). To obtain these dates, you need to set up mapped or calculated variables of the DateTime type (see Formula Editor for an example). |

|
Opens a list of chart end options, for example,Project End Year, Economic Limit, First Production, First Capital or Last Non-Zero Date (the last date for which there are data). To obtain these dates, you need to set up mapped or calculated variables of the DateTime type (see Formula Editor for an example). |

|
Opens the list of dates which can be added to the chart as markers; it includes all options from the chart start menu and the chart end menu. Markers are used when you want to see more than two dates on the chart; for example, first production or economic limit against the full duration of the project. The Manage Markers option is used to set up colors and shapes of markers. The Marker Legend option displays or hides the legend. |

|
Opens the Color Picker dialog. |

|
Sets the chart's start and end year to Project Start Year and Project End Year. |

|
Refreshes the chart if it has not been updated automatically. |

|
Opens the Define Project Dependency window with the settings for the selected dependency. |
| Search By: Project Name | Searches the project list by name. To clear the search filter, click the X button in the field; to see the full list of projects again, perform a blank search. |
To scroll the timeline quickly, hold down the CTRL key, place the mouse pointer at the top of the panel, press the left mouse button and move the mouse to the left or to the right.
To zoom in or out, place the mouse pointer at the top of the panel, press the left mouse button and move the mouse to the left or to the right. The chart will expand or shrink accordingly.
To shift a project, place the mouse pointer over its bar, press the left mouse button and drag the bar in the required direction: to the right to shift the project into the future, or to the left to move it closer to the original starting date. All visualizations will be automatically updated to match the new parameters. Also, the new shift values will be copied into the corresponding column in the Projects View tab.
Note: If a project belongs to a type which does not allow shifting, it will snap back into its original position when you try to drag it. The same thing will happen if you exceed shifting boundaries set in the Range Settings band on the Projects View tab.
You can shift multiple projects simultaneously: click the bars while holding down CTRL to select projects, and then drag the bars to shift. If you have grouped projects on the Projects View tab, you can shift the whole group by dragging its header; this works even if not all projects in the selected group are included into the portfolio.
