Client software errors
Log files
The log files for the Planning Space client are stored at the location '%LOCALAPPDATA%\Aucerna\Logs' (i.e., typically 'C:\Users\{USERNAME}\AppData\Local\Aucerna\Logs'). There are separate logs for the general client, each Planning Space module (Dataflow, Economics, Financials, etc.), and web browser errors.
These files are specific to each user account; however the same log files are used when clients for different Planning Space servers are installed.
Unhandled exceptions
Exception error dialogs look like the following:

Full details of the error can be accessed by clicking the Error Details expander.
Exception errors are also logged in the client-side log file ('%LOCALAPPDATA%\Aucerna\Logs'), with the stack trace details.
When reporting unhandled exceptions the stack trace information is essential.
It is recommended that an SMTP server is configured for IPS/Planning Space so that users can access the Send report to support button in the error dialogs. Otherwise, you should use Copy to clipboard and send a separate email message, to the address planning.support@quorumsoftware.com.
For version 16.5 Update 22 and later: The Planning Space client does not have access to the server's email configuration. The client now uses the 'mailto' action in the user's local context, which must be configured to use an email client.
Planning Space module errors
The Planning Space applications (Dataflow, Economics, Financials, etc) run in Windows as sub-module programs, and it is possible for one of those to crash while the Planning Space client itself does not crash. You will see an error dialog of the form "PlanningSpace Dataflow has stopped working" with options to Close the program or Debug the program. If you click 'Close' then you may be able to continue working in one of the other applications; however it is a good idea to save your current work as soon as possible and re-start the Planning Space client completely.
To diagnose this type of error, you can use the Windows Reliability Monitor to find client-side messages.
On the server side (for a clustered deployment you will need to identify the specific server machine that was involved) error messages may be written in the logs '%SystemRoot%\System32\Winevt\Logs\Application.evtx' or '%SystemRoot%\System32\Winevt\Logs\System.evtx' (these can be searched/filtered using a relevant keyword, e.g. 'palantirdataflow.exe').
Some specific issues
Planning Space modules do not load/run
When the Planning Space client is started, the applications Dataflow and Reserves are automatically-loaded for use. The other applications are only loaded by explicit request; you click the application's circular icon on the client home screen, or the application name on the client menu.
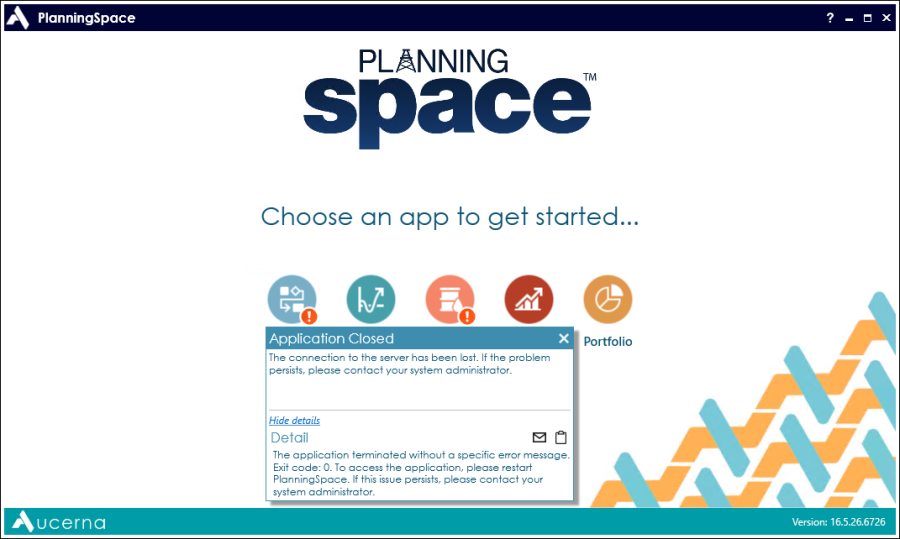
If there is a loading error then a small, red exclamation icon
![]() appears over the
circular application icon. If you click the exclamation icon then you will see a short error message, and click
Show details for a longer error message (you can copy that information to the
clipboard, using the 'clipboard' button).
appears over the
circular application icon. If you click the exclamation icon then you will see a short error message, and click
Show details for a longer error message (you can copy that information to the
clipboard, using the 'clipboard' button).
Note: This type of error may be caused by a sustained network outage, thus causing a disconnection between the application client and the Planning Space IPS server. If the error message refers to "connection to the server" then the initial investigation step should be to check the status of the client-server network connection.
It isn't possible to re-start an application from within Planning Space, after this type of failure (even if the cause of the failure at the server side has been fixed). You need to close Planning Space completely and re-start.
Planning Space Portfolio issues
Portfolio (unlike Dataflow, Economics and Financials) is a client-side application and does not connect to the tenant database, except when using the Load Data tools to connect to the Planning Space or CX applications.
Performance issues for Portfolio are typically caused by local memory usage, or number of users on a shared server in the case of a deployment using an application provisioning service, for example Citrix (diagnostic information may be available to client users via the Citrix Task Manager).
Windows Reliability Monitor
This Windows utility reports on software events (Windows updates, application crashes, etc) which may be relevant for determining the cause of a Planning Space issue.
The utility is accessed using Control Panel > System and Security > Security and Maintenance > Maintenance > View reliability history.

This information will be typically more relevant for client-side errors, where users are running the Planning Space client UI.