Plot snapshots on charts
You can use data from snapshots to build charts. To do it, follow these steps:
- Prepare the data (see Prepare data for charting).
- On the Visualizations tab, add the chart of the required type.
- Right-click on the chart and select the Properties option. In the Properties window, open the Series tab.
- In the Data Source field, select Snapshots Periodic Data or Snapshots Summary Data, and then select the variable to plot.
- The Display By field will be automatically set to Snapshot Name. This is the only available option.
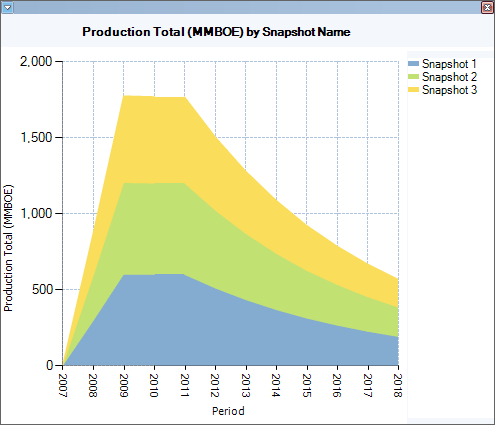
- Save the settings and close the Properties window, and the chart will be displayed as shown below.
Note: Page-level filters using properties are not available for snapshot charts.

Note: If you rename snapshots after you have built the chart, these changes will not be automatically shown. To update the chart, you will need to repeat the data preparation process.