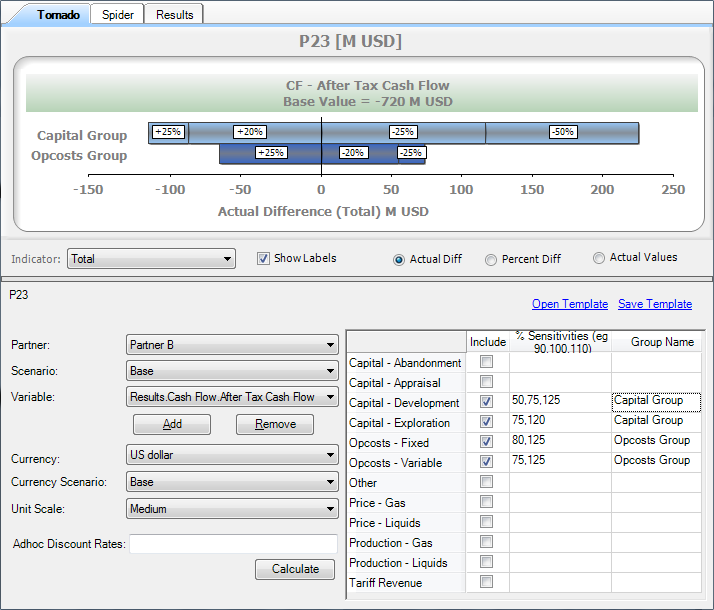
Sensitivity Viewer
The Sensitivity Viewer is a charting tool which allows you to see the impact of changes in certain variable categories on individual variables. To open it, calculate the project and then click on  on the Palantir tab on the ribbon. This topic describes the Sensitivity Viewer screen elements; for instructions on how to use it, see Build tornado and spider charts.
You can view the results as two different types of charts or plain text. To switch between views, select one of the tabs: Tornado, Spider or Results.

The Tornado tab shows value changes in the bar form. The thickness of the bar does not depend on any values and is selected automatically for better visual presentation. The Indicator field contains the list of discount rates taken from the Calculation Parameters document associated with the selected project. If you enter any ad-hoc discount rates, they will also appear on this list. Select an item from the list to view the corresponding calculation results.
| Field | Description |
|---|---|
| Show Labels | Displays or hides percentage labels on the bar which indicate sensitivities. |
| Actual Diff | Displays the difference as the difference of actual values. |
| Percent Diff | Displays the difference as percentage. |
| Actual Values | Displays the actual values. |
You can edit and save the chart by using its context menu; right-click to open it.
| Item | Description |
|---|---|
| Chart Wizard | Changes chart type and chart display settings. |
| Copy to Clipboard | Copies the image to the clipboard. |
| Edit Colors | Changes the colors for groups or variable categories. |
| Export to CSV | Saves the chart as a Comma Separated Values file on your computer. |
| Save Chart as Image | Saves the chart as an image. |
The Spider tab contains a different representation of calculated values. You can view the results for different NPV values by selecting them from the list in the Indicator field. The Show Labels field is not used on this tab.
The Results tab shows the precise calculation results as plain text which can be copied. You can view the results for different NPV values by selecting them from the list in the Indicator field. You can also switch between actual and percentage values by selecting the Actual Diff or Percent Diff option. The Show Labels field is not used on this tab.
Settings in the Sensitivity Viewer can be saved as a template for future use by clicking on the Save Template link. If you have saved a template before, you can load it by clicking on the Open Template link.