Generate a result set report
Once you have created your result set run(s) you can generate result set reports. For instructions on how to create result set runs, see Create a result set.
Two types of reporting are available:
- Standard reporting, where you can generate reports using templates that you specify, based on the data in specific runs in one result set.
- Incremental reporting, where you select two result sets, match up the corresponding runs from each result set, and then a 'delta' is calculated between the two result sets. Note that subtractions are applied for the Numeric variables in the report template, while Text and Date variables take their values from the primary result set run. The output reports can use the same report templates as for Standard reporting, but they will contain the delta data.
Configure Standard reporting
In the Result Sets explorer, double click on a calculated run (that is, a run which has the icon
![]() )
to open it (or use right-click and Open).
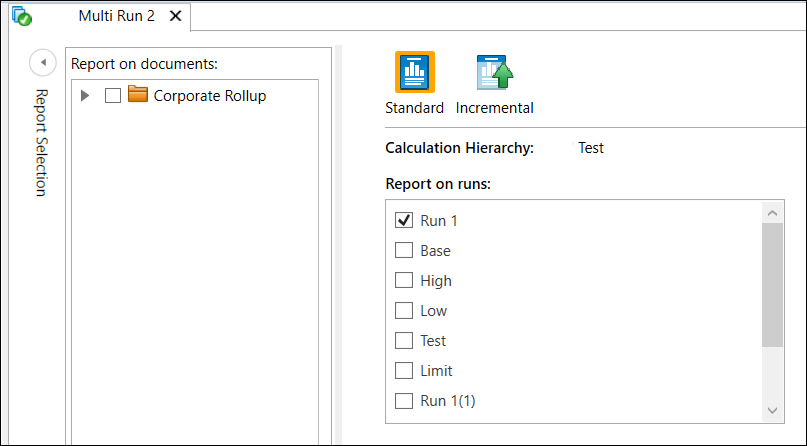
Click the Standard button (which is the default selection):
)
to open it (or use right-click and Open).
Click the Standard button (which is the default selection):

The runs within that result set will be shown in the list Report on runs. Use the check boxes to select which runs are to be included.
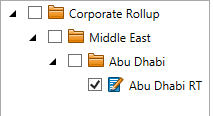
In the Calculation Hierarchy, select the folders and projects that you want to be included (and use the Generate Reports For options in Report Selection to specify how reports will be mapped to these folders and projects):

Only projects that have been calculated in the result set will be available.
For version 16.4 Update 3 and later: the Calculation Hierarchy has a context menu (accessed using right-click on a folder) which allows you to Expand or Collapse the view of the contents of the folder.
Configure Incremental reporting
In the Result Sets explorer, double click on a calculated run (that is, a run which has the icon
![]() )
to open it. This will be used as the selection for the Primary Result Set.
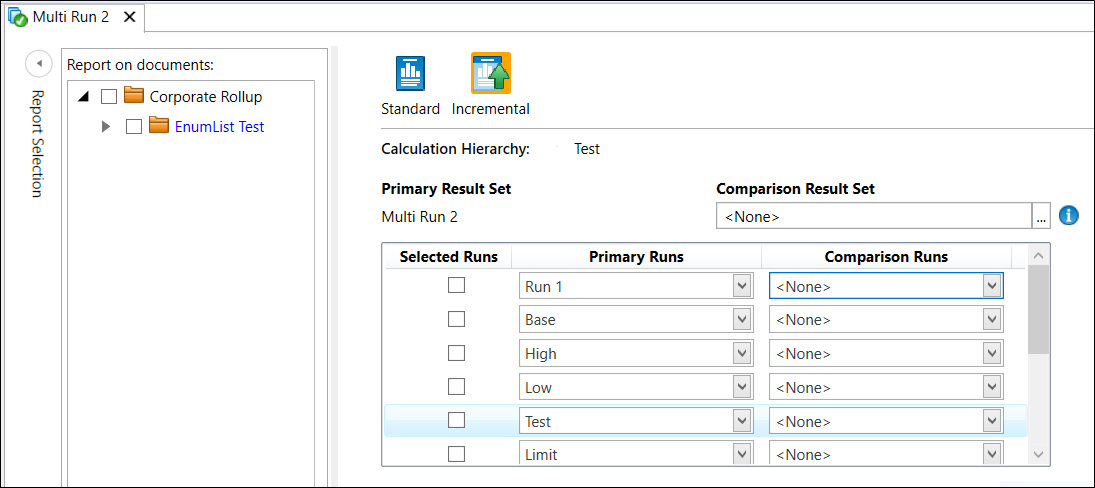
Click the Incremental button.
)
to open it. This will be used as the selection for the Primary Result Set.
Click the Incremental button.

Select a result set to be the Comparison Result Set.
In the Runs box, use the checkboxes to check which runs will be included, and for each Primary Run selected, you need to select a Comparison Run from the other result set.
In the Calculation Hierarchy, select the folders and projects that you want to be included (and use the Generate Reports For options in Report Selection to specify how reports will be mapped to these folders and projects).
The hierarchy view will show (by highlighting in color) the differences between the two result sets, that is whether a folder/project is contained in only one of the two result sets, or in both.
Set the Report Options and Additional Net Partners

For Version 16.4 Update 5 and later: Report Options Presets can be used to store settings and hence automatically fill-in this information. See Report Options presets).
Specify the settings for Options as shown in the table below.
| Setting | Description |
|---|---|
| Start Date | Specifies the start date for the result set report. |
| End Date |
Specifies the end date for the result set report. By default, this is set to its economic limit. However, you can change it to either a specific date, or a duration (fixed number of years). Note: The Start Date and End Date must be within the dates that were specified when the result set run was calculated. Values from outside of those dates cannot be returned. |
| Reporting preset | Specifies a Report (Currency and Discounting) Preset for the result set report (see Report (Currency and Discounting) presets). |
| Periodicity | Specifies the periodicity of displayed values (Annually, Semi-annually, Quarterly or Monthly). |
| Unit System | Specifies the measurement units, Imperial or Metric. |
| Unit Size | Specifies the unit size (Small, Medium or Large). |
| Real / Nominal | Specifies whether or not to apply inflation to project values. The inflation date used will be the one that is specified in each project. |
| Default Partner | Allows you to specify the default values that will be displayed in the report. Gross will display 100%, while selecting a partner will display the corresponding share. |
Additional Net Partners

The partners that were made available for the result set run pre-calculation can be found in the drop-down menus (see Create a result set). The partners that you select here will have their corresponding share of any variables that have been linked to specific net partners displayed in the result set report (see Add a working interest share).
Select the report templates
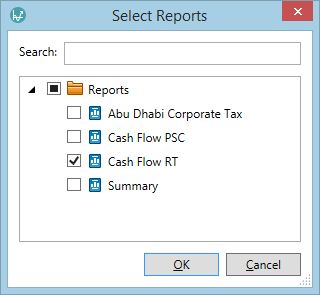
In the Report Selection field, click Add. The Select Reports dialog will open.

Select the report(s) that you want to use. You can search for reports using the bar at the top of the dialog.
If no reports appear for selection, you will need to create a report template (see Create a report template).
Added reports will appear in the Report Selection field.
Click OK to finish report selection and close the dialog.
Set the checkboxes Generate Reports for: Folders and Generate Reports for: Projects to specify how reports will be mapped to folders and projects in the hierarchy.
Generate the reports
Click the Generate Report  button on the ribbon.
Each
report generation will be performed as a job on the IPS Server.
The Task Notification area at the bottom right of the screen
will display the progress of the job(s). When each report is complete an alert balloon will appear as shown.

Once the report generation has completed, you will be able to open reports, or view their job logs, by clicking the down-arrow on the right-hand side of each job item in the task notification list:

If you click Open Report, the report will be displayed as spreadsheet objects inside a new tab in the document pane.
Use the Result Set Reports hierarchy view to select the different reports.

For version 16.4 Update 3 and later: the Result Set Reports hierarchy has a context menu (accessed using right-click on a node) which allows you to Expand or Collapse the view of the contents of the node.
Note that sometimes the variables displayed in a result set report will have a gray fill with no values displayed. This can be due to one of the following reasons:
- the variable does not exist in the regime, or,
- the variable has not been set to be saved in result sets in the regime variable editor (see Edit variables), and the option to store all variables for auditing purposes was not selected for the result set calculation (see Create a result set).
Where result set reports have been generated from folders, it may be that the sub-projects underneath the folder were calculated with different regimes. A variable may be formatted with a gray fill if:
- the variable does not exist in one or more of the regimes used in calculation, or if
- the variable has not been set to be saved in the result sets in the regime variable editor, in one or more of the regimes, and the option to store all variables for auditing purposes was not selected for the result set calculation.
Exporting generated reports
To export the generated reports, switch to the Report Viewer tab on the ribbon and click the Export
button  . You can then specify a location where a Zip
file containing all the generated reports will be saved. Note that any changes made to the reports in the
Report Viewer will not be retained when exporting. The ZIP file will contain a folder structure
that replicates the hierarchy view, where
each report will be located in its appropriate hierarchy location. The reports are saved in 'XLSX' format
and can be opened for viewing and editing in Excel or another spreadsheet application.
