Tables and line items
Dataflow has two types of tables for periodic data: simple tables and multilevel tables. A simple table has only one level: it contains variables and values for them (see the image below).

Like other data fields in Dataflow, table cells will have different colors depending on their state. Cells with a white background can be edited, cells with a light blue background are calculated expressions, and cells with a turquoise border have been edited.
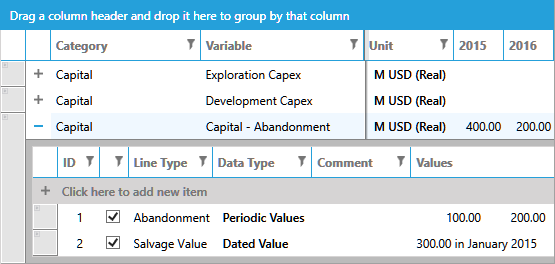
Multilevel tables have two levels: the upper level contains the variable and the lower level contains line items for that variable. To view or add line items, click the '+' sign. In the example shown the variable 'Capital – Abandonment' has two line items belonging to the types 'Abandonment' and 'Salvage Value'.

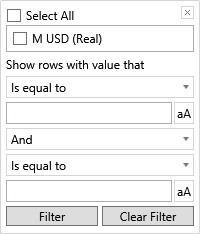
If you click the  button next to any column name, a filter dialog will be displayed. Here you can set up filters to show items which match particular criteria.

To remove a filter, open the filter dialog again and click the Clear Filter button.
When you open a multilevel table, a new tab is added to the ribbon called Line Item. It contains two buttons (Add and Remove) which allow you to add and remove line items. These options are also available from the context menu when you right-click on a table. For detailed information, see Add a line item to a table and Remove a line item from a table.
