Report Designer
This section contains information about the basic principles of creating reports with the Report Designer. The Report Designer allows you to create new reports from scratch and bind them to data.
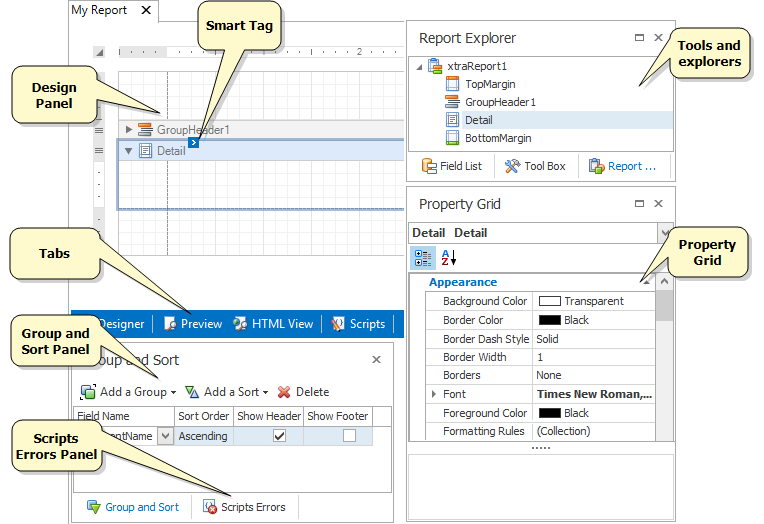
To open the Report Designer, go to the Report Templates workspace. Below you can see an example of a report template being edited in the Report Designer.

The table below describes the main elements of the Report Designer. For more information, see Report Designer User Interface.
| Element | Description |
|---|---|
| Toolbox | Contains controls that you can add to your report by dragging and dropping its icons onto a report's area. |
| Design Panel | A surface where a report is being edited. The Report Designer provides a multi-document interface; you can edit several templates at once. |
| Smart Tag | Most report elements have Smart Tags that provide easy access to the most frequently-used settings. |
| Tabs | Allow you to switch between different modes. For details, see Designer tab, Preview tab, HTML View tab and Scripts tab. |
| Report Explorer | Displays the structure of a report in a visual-tree form, which makes the report navigation easier. |
| Field List | Shows the structure of a report's data source and is used to bind report controls to data. |
| Property Grid | Used to access and modify properties of a report and all its elements (bands and controls). |
| Group and Sort Panel | Allows you to quickly perform grouping and sorting operations throughout a report, and visually represents the report's grouping structure. |
| Scripts Errors Panel | Lists errors found in a report's scripts. Clicking on an error opens the corresponding script section on the Scripts tab. |
