Making Execute's Dashboard more Useful
Overview
Execute’s dashboard is now more customizable and more useful than ever before. Changes to Browsing, Reporting and the Dashboard have yielded the following changes:
- Administrators can select any browse report to be a “Global Widget” and control who sees it
- More options for users. Users can now:
- rearrange widgets on their dashboard
- hide widgets they don’t need
- add their own Browse Reports as dashboard widgets
- Customized charts
User Report Widgets
One of the many new tricks in the Execute dashboard is that a user’s browse reports are now available as Dashboard Widgets.
There are limitations with user reports. Both prevent user widgets from having detrimental effects on AFE Nav’s performance:
- User Report Widgets are limited to 10 rows per widget. There is a “view report” button on the widget that takes the user to the full report on the browse screen. The widget includes a row count in the top right corner so users know that rows are being hidden.
- Widgets based on User Reports never query archived documents. Widgets are meant for operational documents. By definition, archived documents are not operational.
Example User Widget
This example will show a user’s Browse Report as a widget on their dashboard.
Browse Report Filter
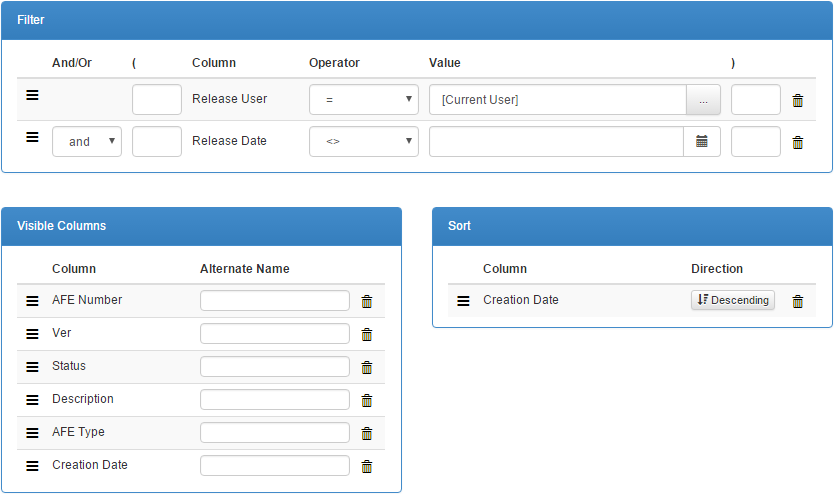
Users start with a Browse Report. Here is one that returns AFEs which were released by the user. It is sorted in reverse chronological order by Creation Date:
Click image to expand or minimize.
Browse Report Result
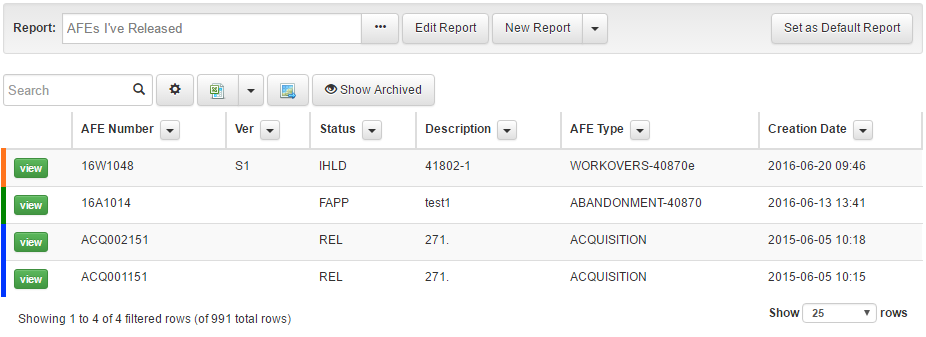
Unsurprisingly it looks like this on the browse screen:
Click image to expand or minimize.
Report as a Widget
Here is the same report added to the user’s own dashboard. Note the record counts and navigation button in the widget’s top right corner.

Click image to expand or minimize.
If the report doesn’t include a defined set of columns, the user’s default columns for that report type will be used (same rules as on the browse screen itself).
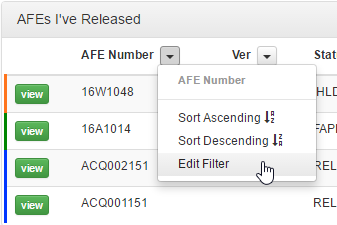
The new ad-hoc column sorting / filtering options on the browse screen work the same way on dashboard widgets as well:
Click image to expand or minimize.
Global Widgets
Now that’s all well and good but can we really rely on users to add their own widgets? Maybe not, but we don’t have to!
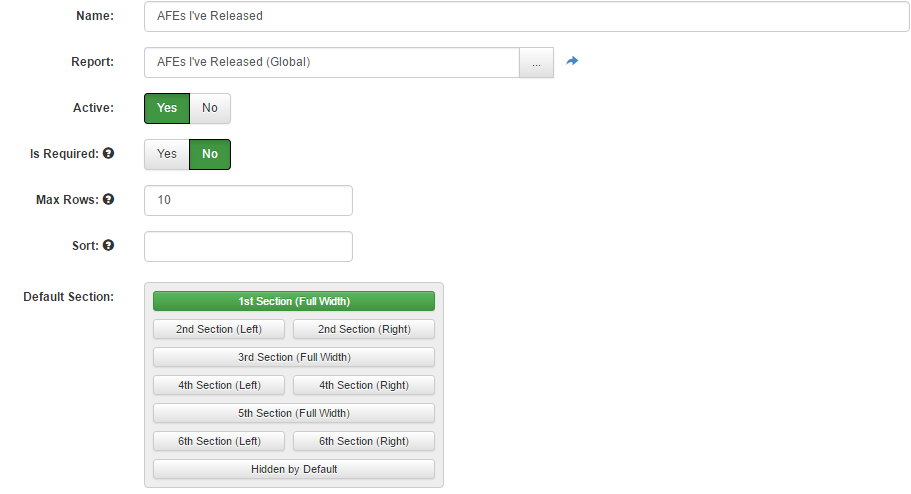
If there are widgets that clients want all clients to see, administrators with the “Manage Global Widgets“ privilege can create and inflict Global Widgets onto all users.
Click image to expand or minimize.
- Name - the widget’s title (shown in the upper left corner)
- Report - the report that the widget will use as a data source
- Active - only active widgets are available on the dashboard
- Is Required - users can not remove required widgets from their dashboard
- Max Rows - the maximum number of rows the widget can show. As with user widgets, there is always a link to the full Browse Report.
- Sort - a numeric sort value used to position the widget within their section. Widgets with a “sort” are first in their respective section (sorted numerically by the sort value). All other widgets in the section are included alphabetically. The user can override this by moving their widgets around.
- Default Section - is the default section (if any) for the widget. This controls where the widget is positioned relative to other widgets. This also defines whether the widget is full width or half width. The user can override this by moving their widgets around.
Administrators can edit each widget’s eligibility rule to configure which users can see the new widget. The rule can check the target user’s privileges and any custom fields on the object itself.

The above example only applies to users who have the term “approver” in their user description.
User Dashboard Configuration
So far we have 3 types of widgets: built-in widgets, user report widgets, and global widgets. This section will cover their configuration. The dashboard now has a “Configure” button:

It takes the user to a new drag-and drop widget configuration page:
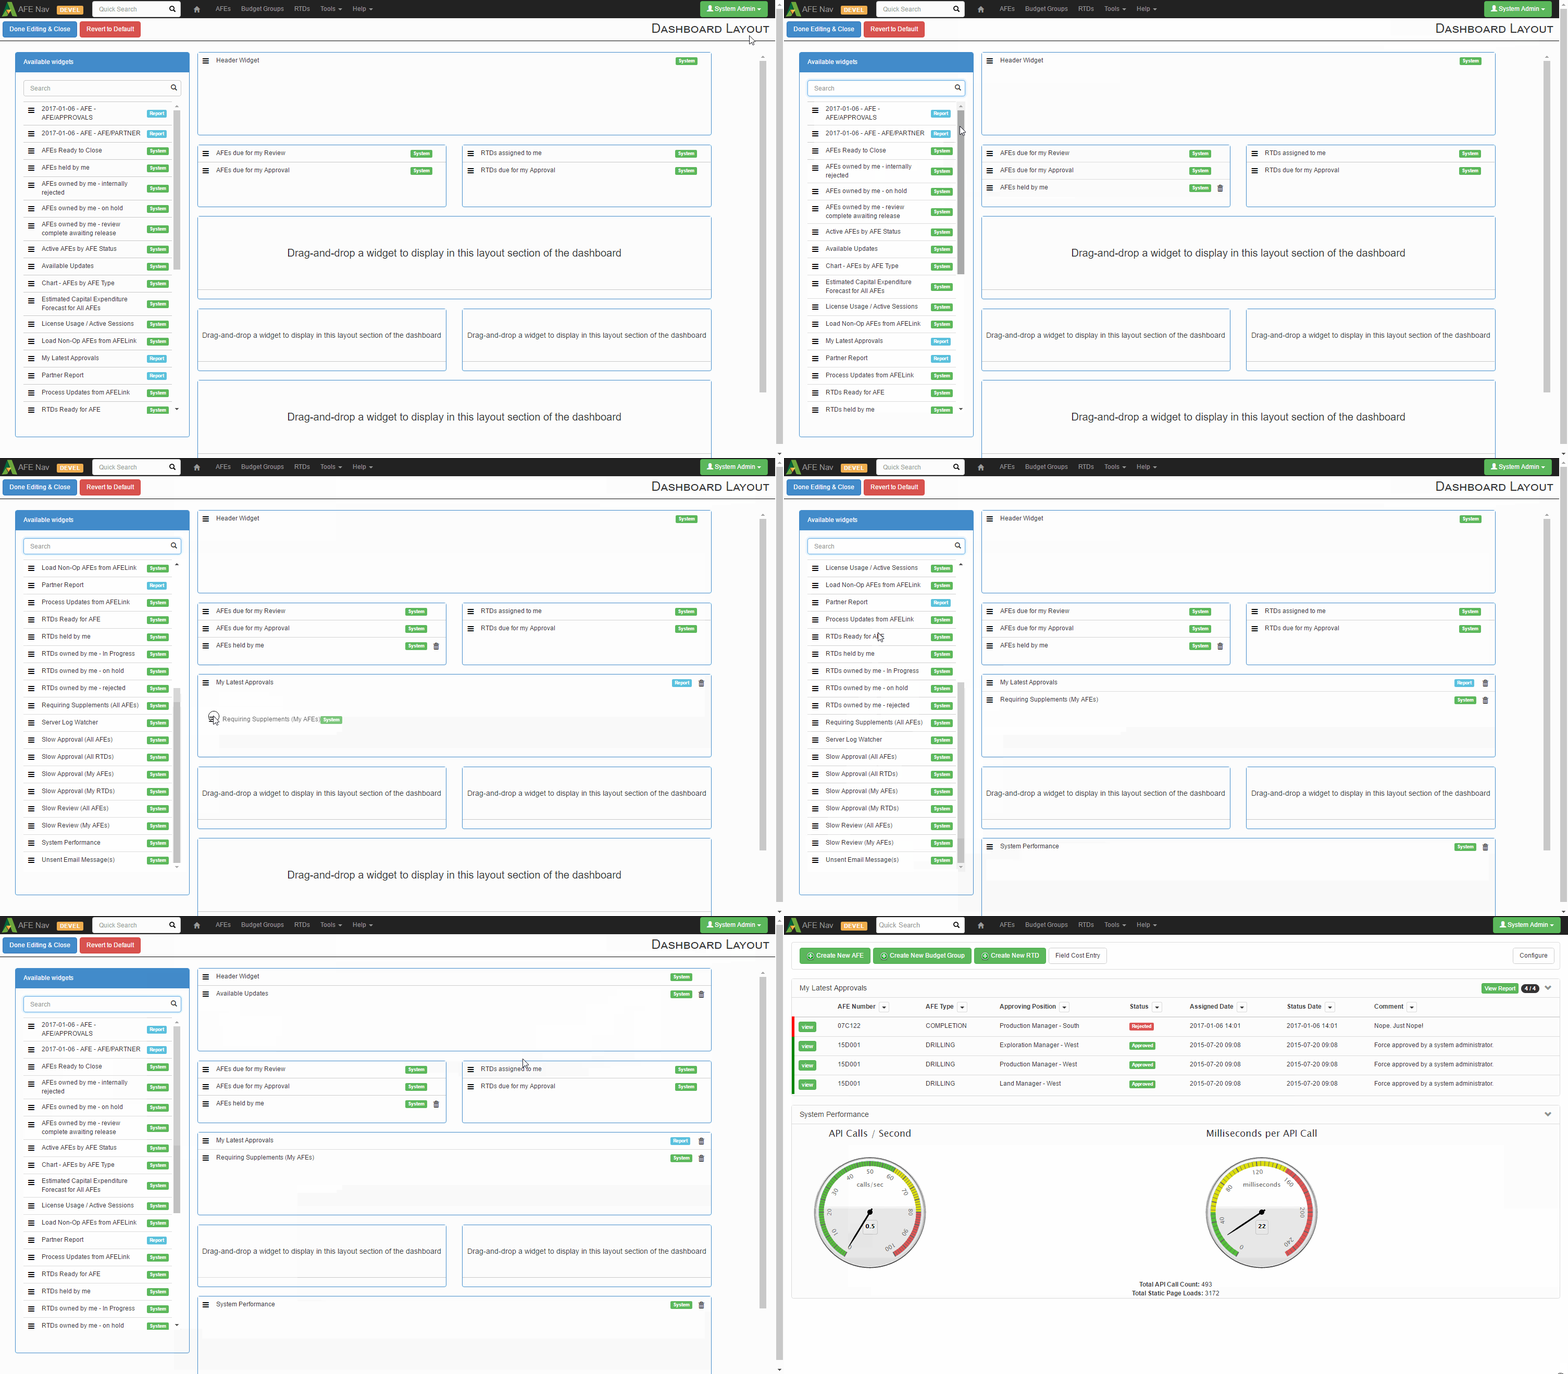
Click image to expand or minimize.
The dashboard is divided into 6 “rows” numbered, creatively 1 through 6. Rows 1, 3, and 5 are full-width rows/sections. Widgets placed in those sections will fill the full width of the dashboard. Rows 2,4, and 6 have two sections (left and right) that are half-width on wide displays.
Users can drag their widgets between the sections to get the layout they want. In addition, users can remove widgets they don’t want, unless the widget is required. Users can also drag in optional widgets and user reports from the list of available widgets on the left.
Click Done Editing & Close to save dashboard changes and return to viewing the dashboard. Revert to Default will go back to a stock dashboard.
User Reports
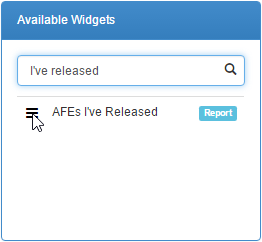
User-created reports can be added to the dashboard by dragging from the “Available Widgets” list on the left. User-created reports are tagged with a blue badge labeled “Report”.
Charting
The dashboard is not limited to tables:

Click image to expand or minimize.
Charts can be added as plugins. They are administrator configured but have some notable properties:
- You can control the sort key and section for a chart widget just as you can any other global widget
- The widget uses a report (All AFEs, My AFEs, etc.) as the source of its data. You can choose what the default is in configuration, or fall back to the user’s default report. You can also decide whether you will allow the user to change the report (the dropdown under the report you see in the screenshot) or whether the report is fixed.
- You can control the number of pie segments or bars to show
- You can control which document path (field) is used to provide the data labels (grouping), and the document path (field) used for the numeric value (or leave blank to simply count records).
- Charts can be set to show only for certain users
- Segments in the chart are clickable links to search for rows with that label in the selected report
Message of the Day
The Header Widget is a special required widget that normally contains:
- the “Configure” button
- new buttons to create new versions each of the primary document types
- a shortcut to the field cost entry screen for users who can import field costs

This widget can optionally host the message of the day.
Configuration
The message is set through Tools > Configuration > Settings > Message of the Day:

Simple Message
Administrators can use this field to add a simple message to all users’ dashboards. This is handy for communicating pending system updates, outages, workflow changes, or whatever!

Markdown Message
The message of the day understands Markdown syntax.
# There is a planned **system outage** over the weekend to install [update 1](https://cloudfront.energynavigator.com/afenav/releases/2018/updates/changes.html). Please log out before then.

What Happens Upon Upgrade?
Things stay about the same. Some default widget locations have moved. Any 8.x custom filters that users have built will now be available as browse reports. Consequently, these are also available as user dashboard widgets.
