Searching for records using the browse page, ad hoc reporting, and configuring the dashboard.
Overview
The browse page and dashboard are where users can search and report on all document types (AFEs, RTDs, etc.) and quickly find their work. Each document type has a browse page that allows you to perform quick ad hoc searches and create reports. Reports that you create in the browse page for primary documents can be configured to show on your dashboard.
The dashboard is an attempt to create a one-stop shop for users to find the information that is important to them. By default, the dashboard shows primary documents (AFEs, RTDs, etc.) requiring your attention or input based on your role in Aucerna Execute.
Browse Page
Each document has its own browse page where you can search for records and create reports. If you have been granted create rights to a document type, the browse page has buttons to create the new document. To access the browse page for a primary document, click on the document name in the toolbar.

For other document types, you can view their browse page by selecting Tools > Configuration and searching for the document name. Then, click the view items button beside the document name to see its browse page.
List of Reports
At the top of the browse page, you can select from a list of reports to control the records being viewed. This list includes Aucerna Execute default reports, browse reports you created or reports an administrator has created and made “global” for your company (the word Global appears in brackets after the report name). When you select a browse report, you will see the records and columns determined by the report.

Click image to expand or minimize.
If you select a global report, you can click the View Report button to see the report outline. This may be helpful in order to see the filters and sorting applied to the report and the name of the report owner. You will not be able to edit a global report (unless you are the owner of that report) or any of the default Aucerna Execute reports. You will only be able to edit your browse reports..
Configuring your Columns
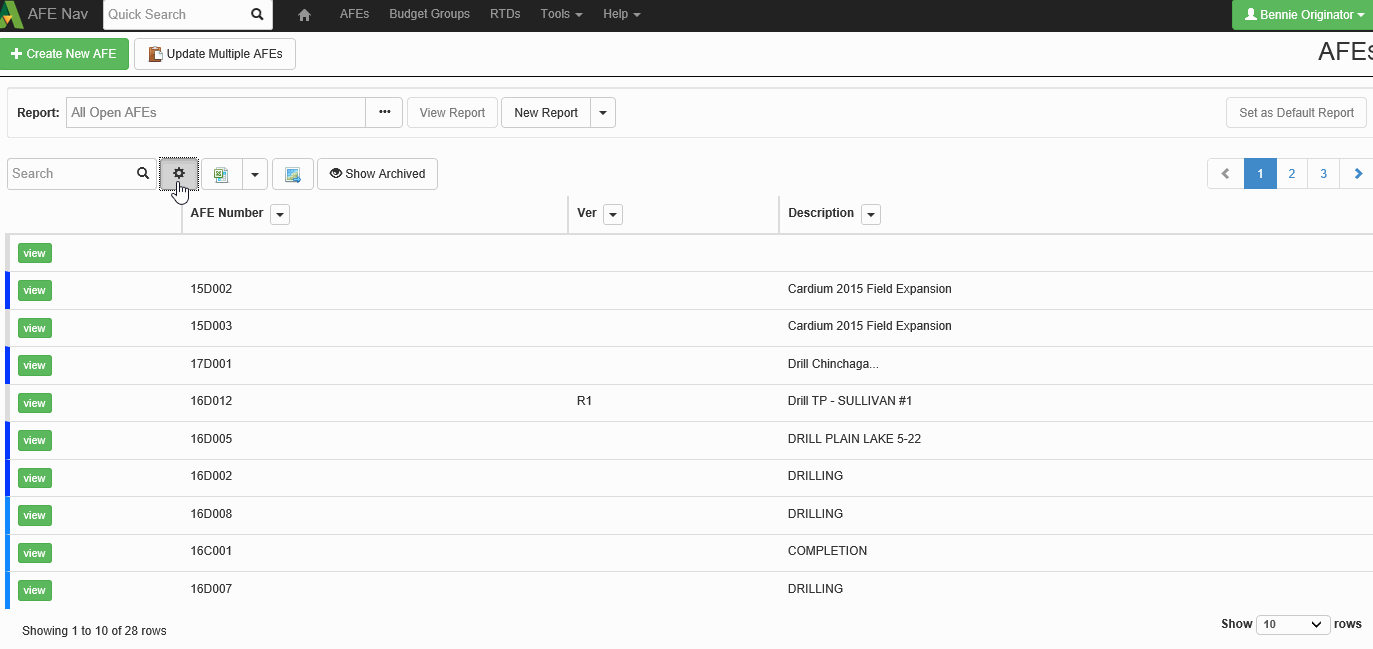
You can configure the columns in the browse page when you are viewing any of the default Aucerna Execute reports or any of your browse reports that don’t specify the columns to include. To configure columns, click the gear button.

Click image to expand or minimize.
Click the Change Visible Columns list to see a list of available fields that can be displayed as a column. You can search for the field name in the window at the top of the list. To select a field for display, click on the field name in the list. Once you have selected all the columns, click off of the list window to close it. To reorder the columns, drag and drop the column to where you want it displayed (the top of the list represents the first column on the left of the page). Click OK to save your changes.
Click image to expand or minimize.
Searching
You can search for records by typing in the Search window. When you type in the search window, it will search for that value across all the displayed columns and filter the records accordingly.

Click image to expand or minimize.
Column Filters and Sorting
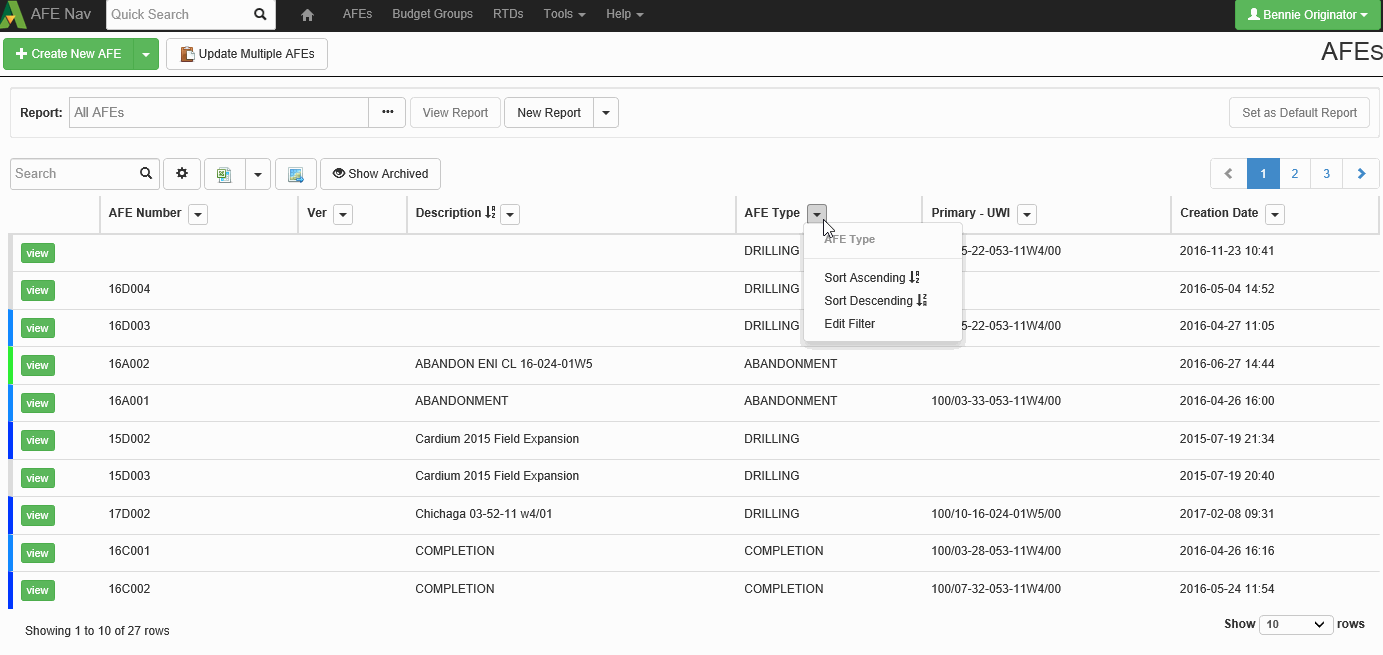
You can create a filter for any column in your browse page. Yocan also specify a column to apply an ascending or descending sort.
To build a filter on a column, click the arrow button by the column title and select Edit Filter. The filter window will differ depending on the column’s field type (ex: list, text, date, etc.).
To apply sorting to the records in the browse page, click the arrow button by the column title and choose between ascending or descending sort.
Click image to expand or minimize.
Status Colors
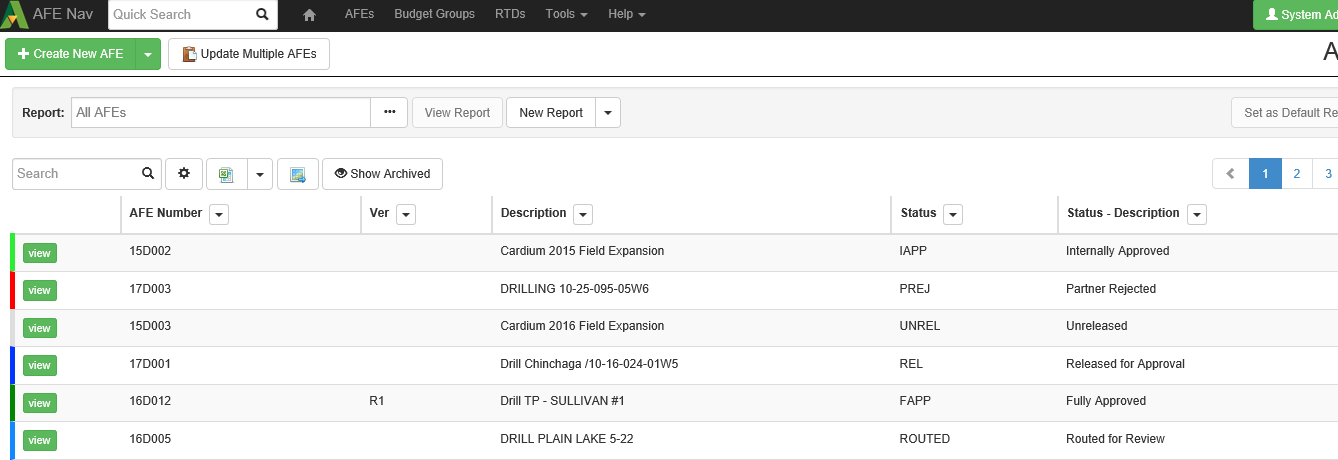
At the beginning of each row in the browse page, you’ll notice a band of color. The color represents the status of the document.
Click image to expand or minimize.
Below is a legend that explains the status color assigned to the AFE, RTD and other document types.
| Color | AFE Status | RTD Status | Other Documents |
|---|---|---|---|
| Grey | Unreleased | In Progress | Active |
| Light Blue | Routed for Review | N/A | N/A |
| Dark Blue | Released | Released | N/A |
| Light Green | Internally Approved | Approved | N/A |
| Dark Green | Fully Approved | Licensed | N/A |
| Red | Either Internally Rejected or Partner Rejected | Rejected | N/A |
| Black | Closed | Closed | In-active |
Export to Excel
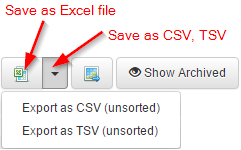
Aucerna Execute allows users to save the results of a filter or a sort. Click the Export to Microsoft Excel button to save the result set as an Excel spreadsheet. Click the arrow button beside the Excel button to save as either a CSV or TSV file.
The exported spreadsheet contains a column that contains a link to the document. When you click on the link, Aucerna Execute will launch (provided you have access to it) and open the document referenced in your spreadsheet.
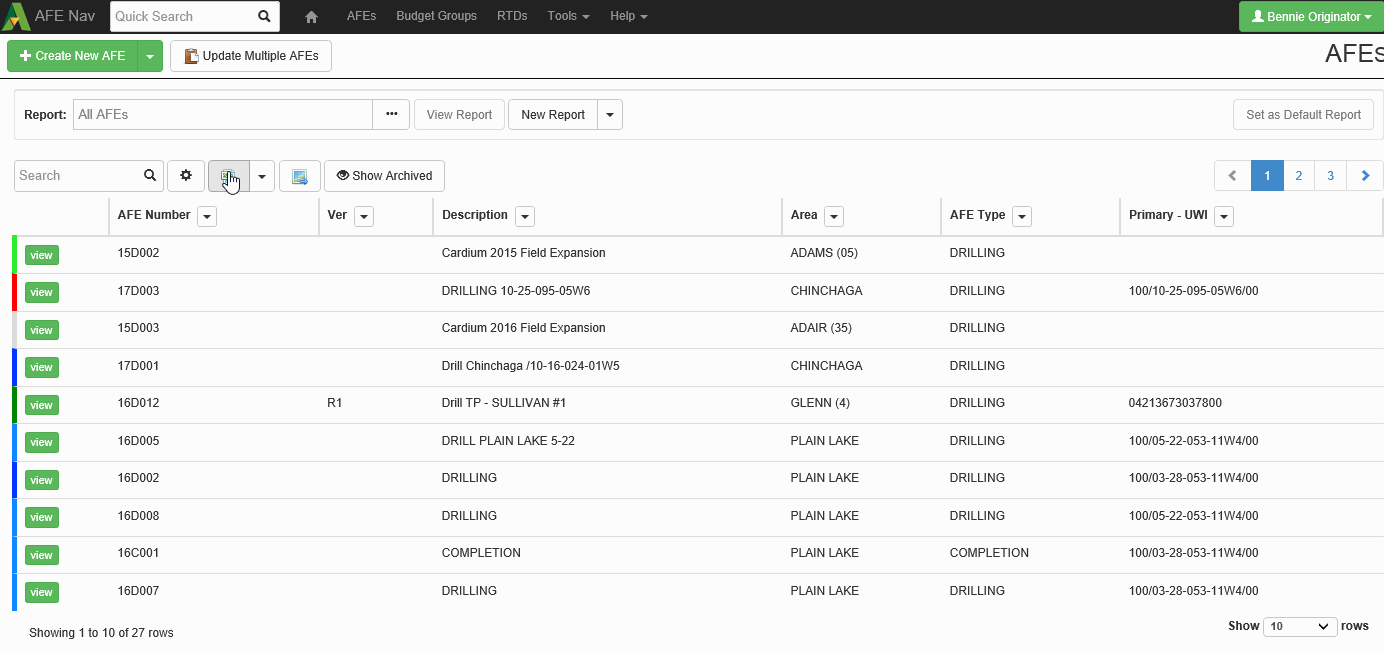
Click image to expand or minimize.
Show Archived
To improve performance of the browse page, archived documents will not show up in searches by default. An administrator can control the criteria that determines whether a document is considered an archived record. If you want to see all the records in the browse page that apply to your search, click the Show Archived button. While viewing archived records, the Show Archived button becomes Hide Archived. Additionally, an “Archived” column (type Yes/No) is available to documents types that have an archive rule.
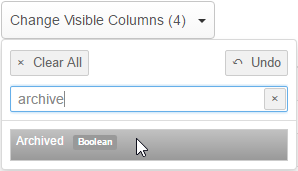
For more information regarding archiving rules, see the Archiving Documents guide.
Browse Reports
A browse report is a report you create in the browse page so you can quickly recall a set of filters and visible columns. In previous versions of Aucerna Execute, we referred to these reports as custom filters. Browse reports can be a big time saver if there is a set of criteria that you regularly use to search for documents. You can find your browse reports in the list of reports at the top of the browse page.
Report Types
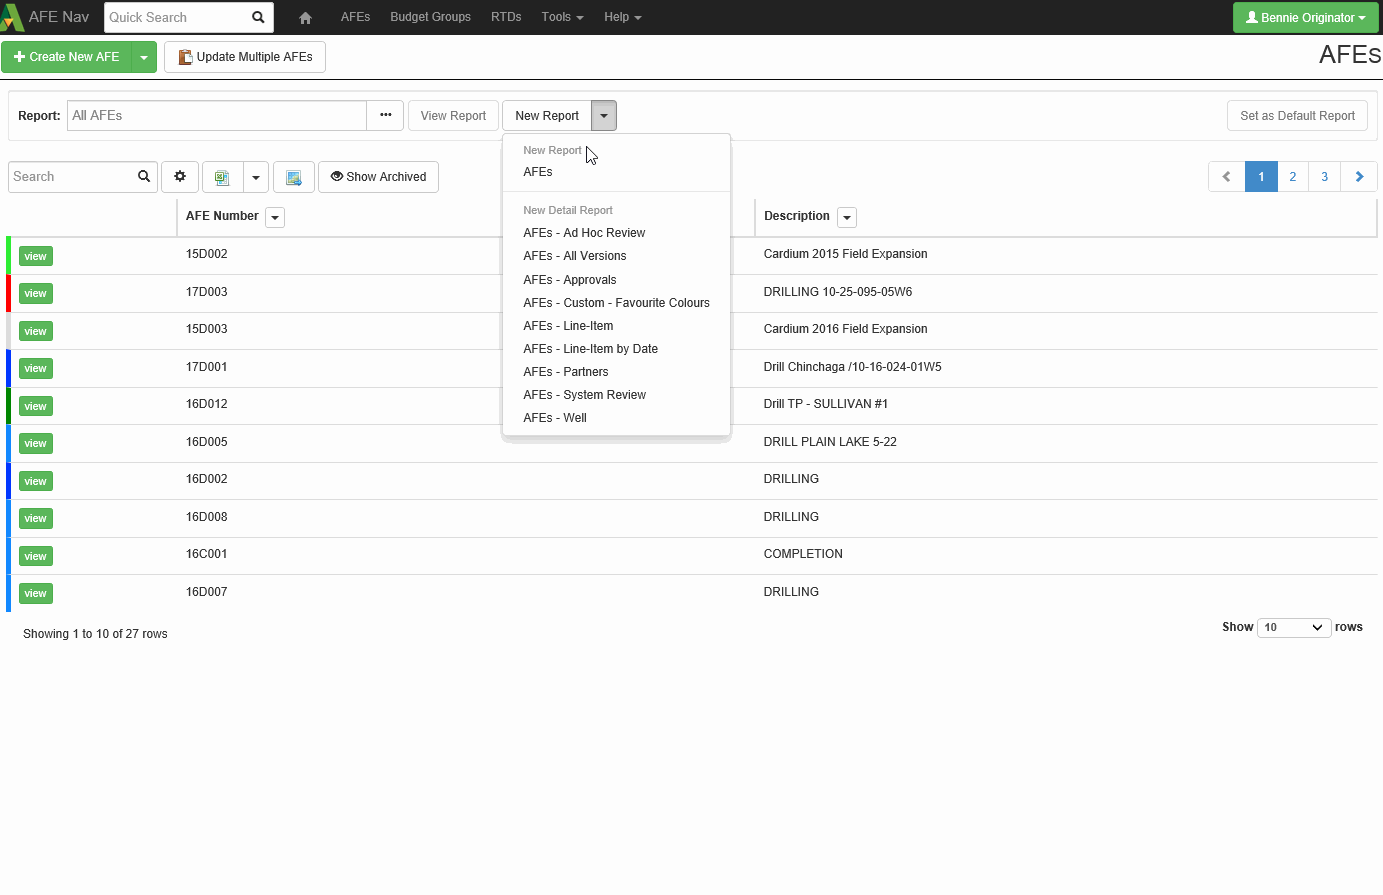
When you create a browse report, the first step is to select the report type. You can see the report types when you click the arrow button beside the New Report button. If you want to report on “top-level” data, select the report type that is the same as the document name (ex: AFEs, RTDs, etc.). If you need to report on child records of your document, select one of the other report types (ex: reporting on AFE or RTD approvals data, AFE or RTD partners, AFE costs per account, any data from a table, etc.).
Creating a Browse Report
To create a browse report, click the arrow button beside the New Report button and select a report type. In the Configuration tab, you must enter some general information like the report name and whether to include archived records. Only an administrator with the Manage Reports privilege can set the report as a global report. The search box works the same as the search box in the browse page; it will search for the value across all visible columns to filter the records returned.
The Available Columns window contains a list of fields you can include as columns, filters or sort criteria. In this list you will find fields on the document, as well as calculations and pre-canned filters (ex: My Work, Due for My Approval, All Open AFEs, My In Progress RTDS, etc.) To build your report, drag the items from the Available Columns window to the Visible Columns, Filter and Sort windows. To save your report, click Done Editing & Close.
Click image to expand or minimize.
Sharing a Browse Report
Browse Reports can be shared with other users. While viewing the report, copy the URL and send it to the person you want to share with. When the other user visits the URL, the report shows up under their list of reports in the browse page.
If that shared report is one you’d like to keep, click View Report > More > Copy Report. After copying the report, you are free to make edits without affecting the original report. Click Done Editing & Close to save the changes.
Dashboard
What is the Dashboard?
The dashboard is the first page you see when you launch Aucerna Execute. It can also be accessed at any time by clicking on the home button or AFE Nav in the toolbar.

Depending on your role in Aucerna Execute and the work that is on your plate, different buttons and widgets appear. If you have rights to create a primary document (AFEs, RTDs, etc.), you will see buttons to start one of these documents (ex: Create New AFE). As a document owner, you will see widgets highlighting your documents that require your attention, like AFEs owned by me that are on hold or internally rejected, AFEs and RTDs waiting to be released for approval, my AFEs that require a supplement, and AFEs and RTDs that are moving slowly through the approval phase. If you are a reviewer on AFEs or a discipline lead on an RTD, you will see those documents requiring your input. An approver will find AFEs that are due for their approval. Administrators may see documents that are stuck in the workflow, documents that can be closed, and documents that can be exported to or imported from another system, like AFELink.
Configuring your Dashboard
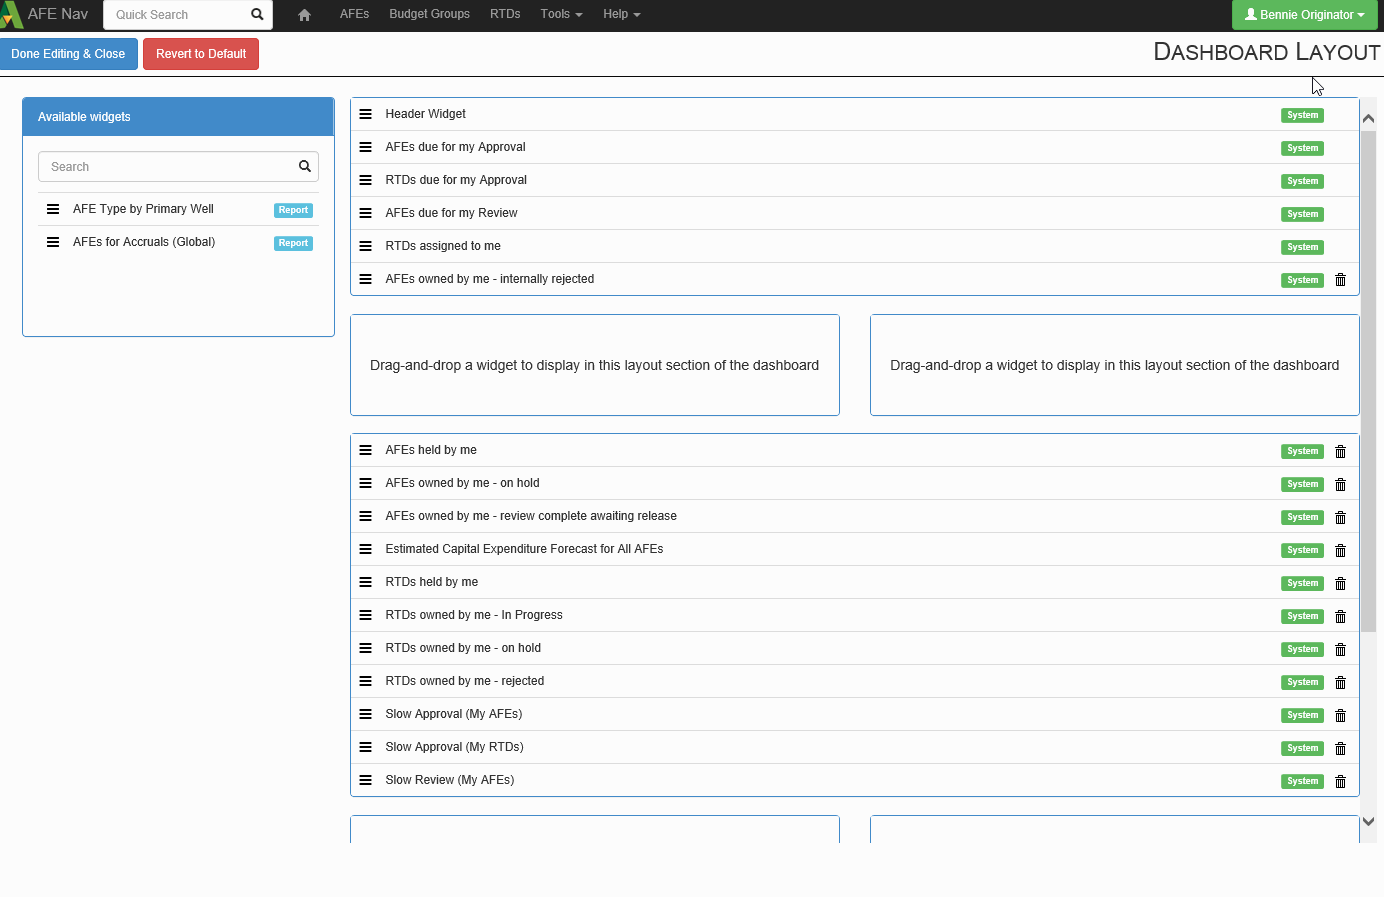
You can customize the display of your dashboard by moving widgets, hiding widgets or displaying your browse reports or global browse reports. Click the Configure button to customize your dashboard layout.

When configuring your dashboard, you’ll notice that widgets are either labeled as System or Report. A system widget is one that is included in the application and a report widget is either one of your browse reports or a browse report that was made global by an administrator. You can move widgets by dragging and dropping them into the different windows. If there is a widget you do not want to see on your dashboard, click the trash can button and it will remove the widget from display and move it into the Available Widgets window. Widgets that display documents that require your input in order to move forward in the workflow cannot be removed from your dashboard, however, you can change where they are displayed. The Available Widgets window contains a list of unused widgets, your browse reports and global browse reports.
To save the changes to your dashboard layout, click Done Editing & Close. You can also click the Revert to Default to return to the default dashboard configuration in Aucerna Execute.
Click image to expand or minimize.
