
Load testing and performance analysis of Aucerna Execute
A test system was set up to characterize the performance of the Aucerna Execute service under high load. Traces were taken of common activities and a tool to replay the network requests as fast as possible was created.
Hardware Configuration
- Aucerna Execute service installed on a desktop PC (Windows 7): Intel i7 3770 CPU (3.4GHz), 16 GB RAM, Samsung Evo 840 SSD
- Database on MS SQL Server: 4x AMD Opteron 8220 (2.79 Ghz), 64 GB RAM, 2x300 GB 10K SAS RAID 0
- Database server dedicated to the test, no other users
- Gigabit Ethernet connections
- Replay scripts run on additional separate PCs
Test Data
Database size: 87000 AFEs
Activity Workloads:
- Select a random browse filter and list all AFEs matching it: 12 service requests
- Open an AFE and view all data: 63 service requests
- Open an AFE and update the AFE description: 11 service requests
- View the main dashboard page: 18 service requests
Testing
The service was started and the performance statistics capture activated before the test. A client PC running each workload script was started. The workload scripts make requests as fast as possible. The scripts ran until the requests per second rate appeared steady. The sustained request rate with 4 workload scripts was approximately 75 requests per second at a CPU load of less than 40%. At this load level, interaction with the user interface was checked and did not respond noticeably slower when the workload scripts were running.
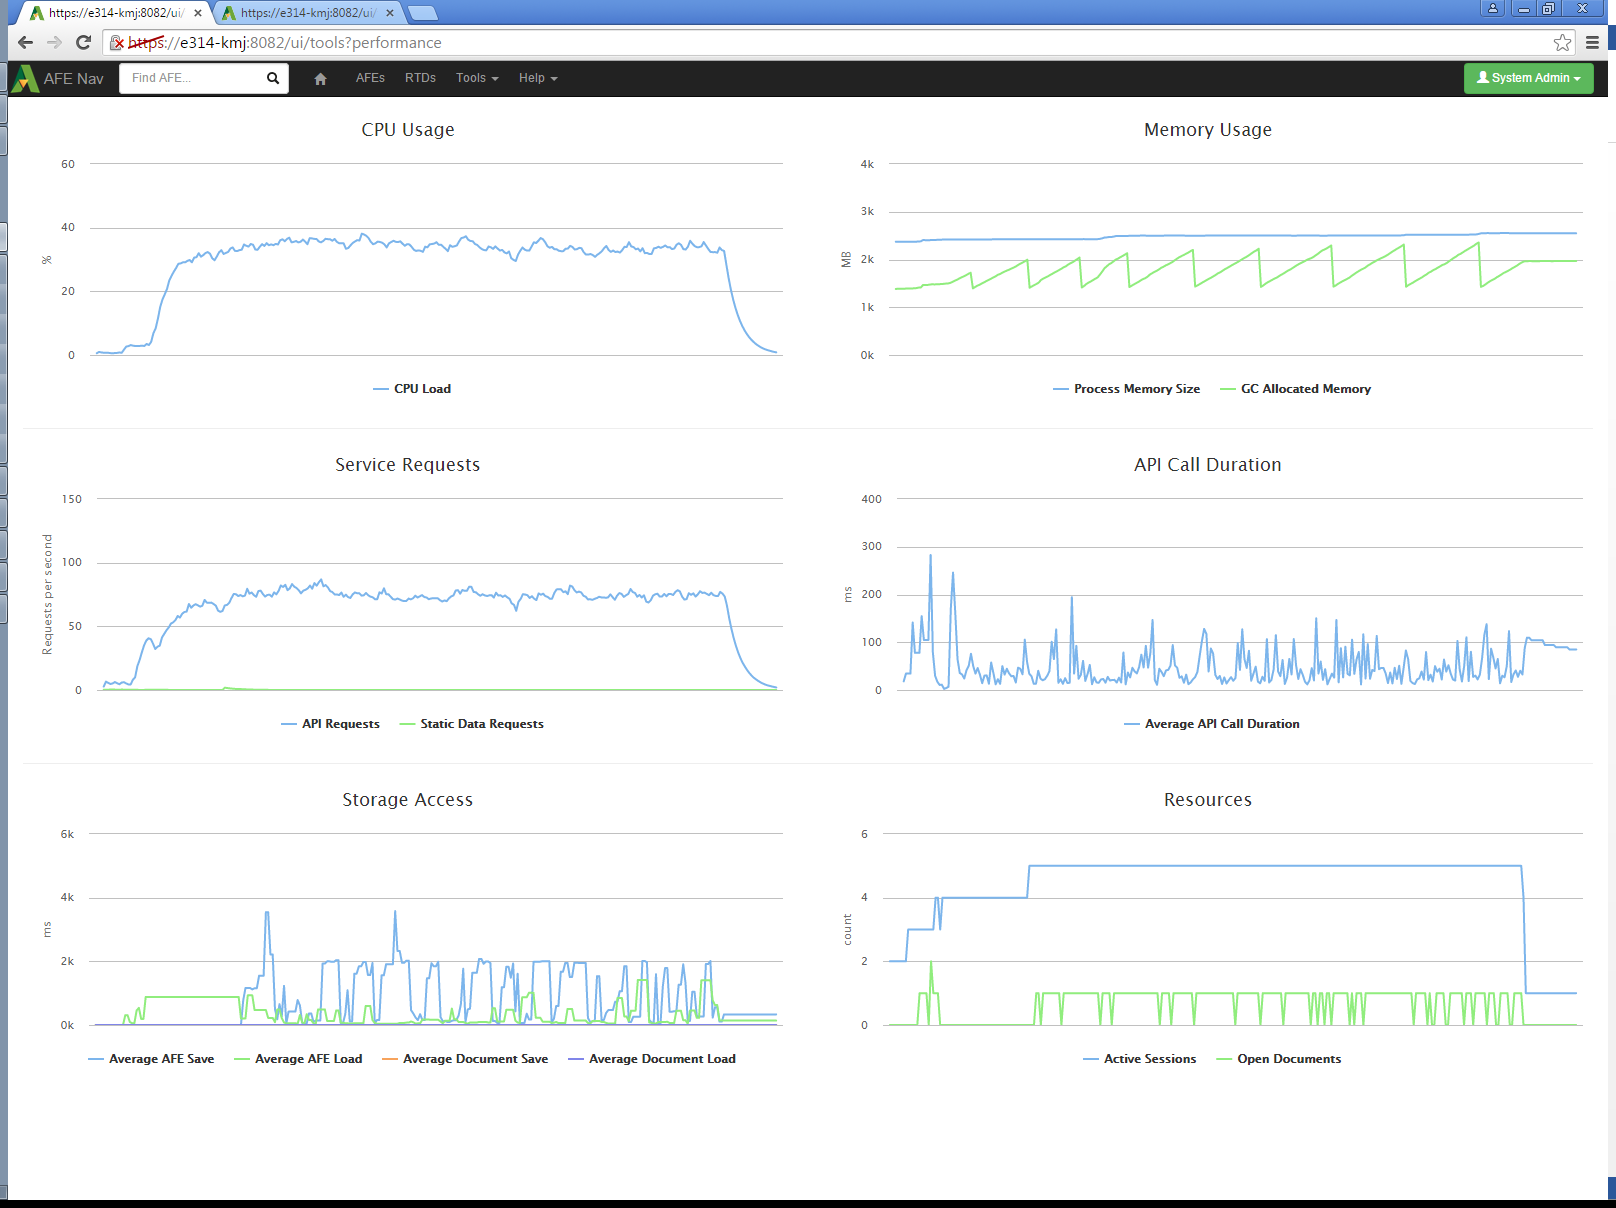
Click image to expand or minimize.
To verify usage of multiple processors, the same workload was run with the service process limited to one CPU core instead of 8. The performance leveled out at about 45 requests per second. The indicated CPU load was near 10%. Since the test was run on a computer with 8 effective CPUs, this is consistent with a single core being continuously busy, which would be 12.5% if there were no overhead or other processes.
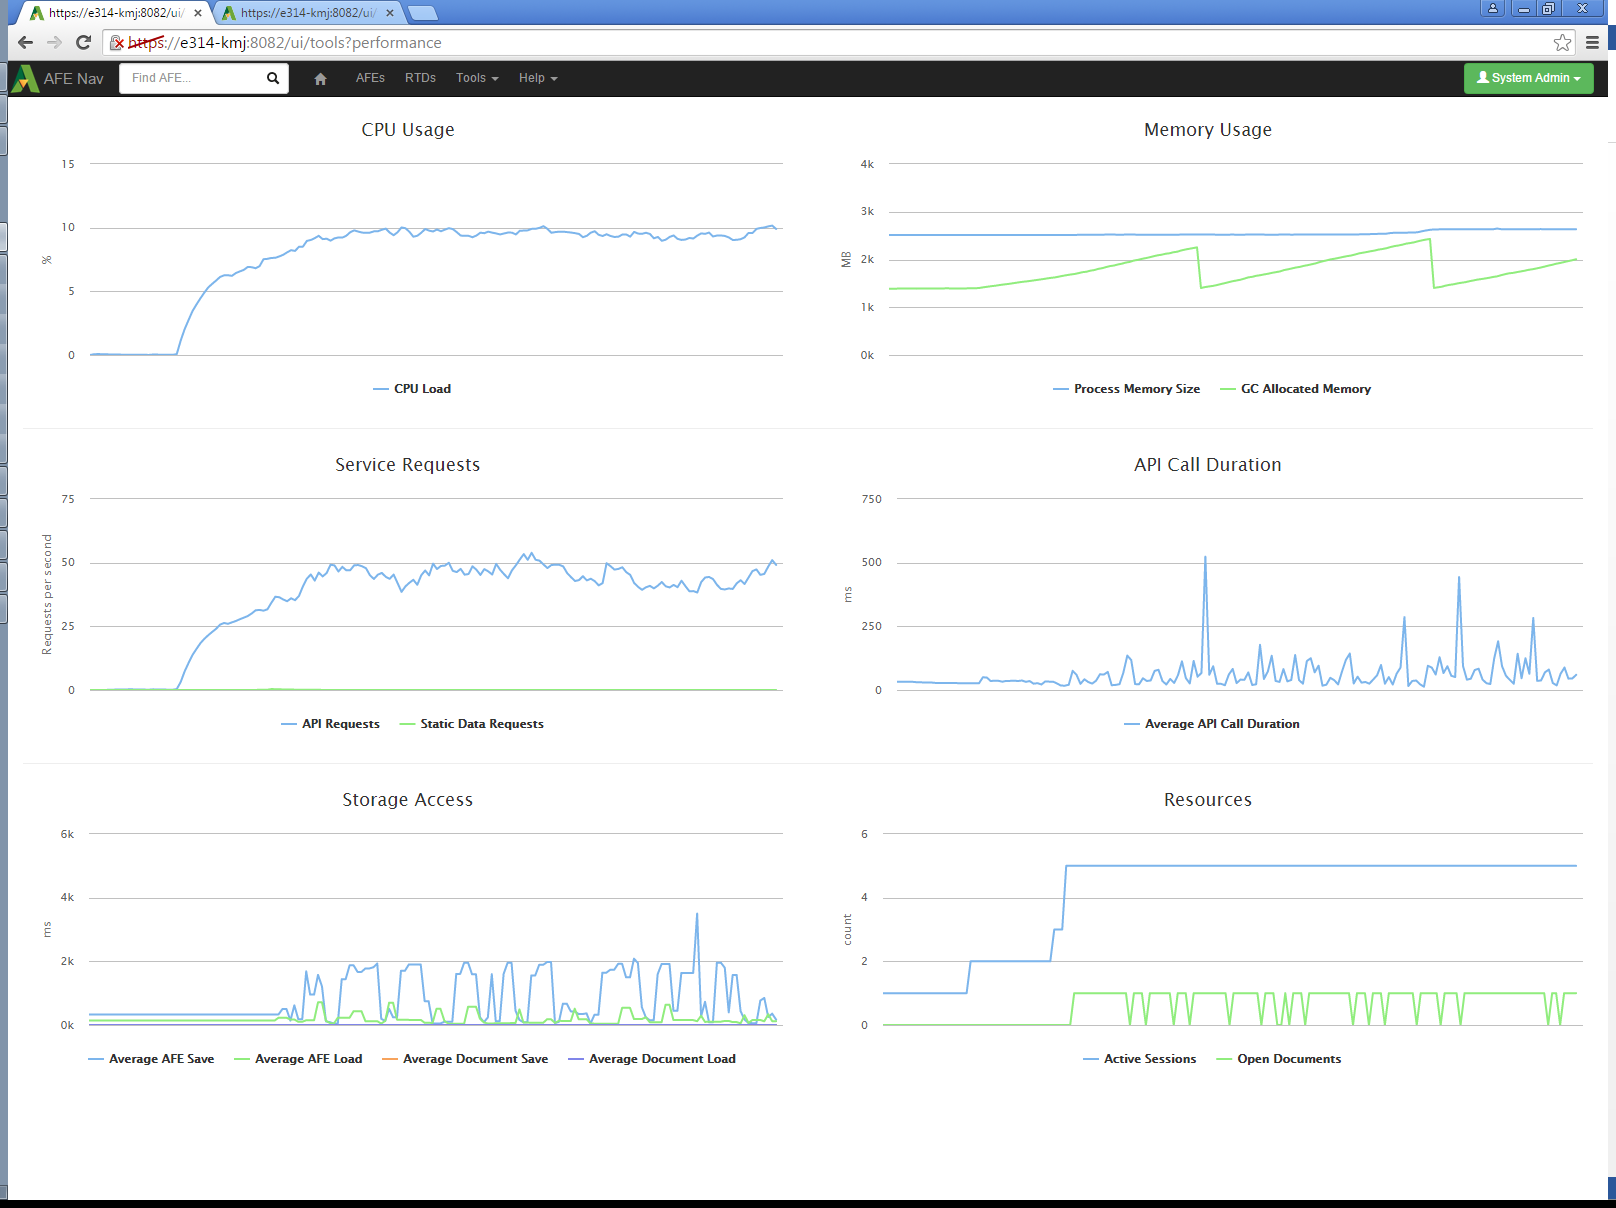
Click image to expand or minimize.
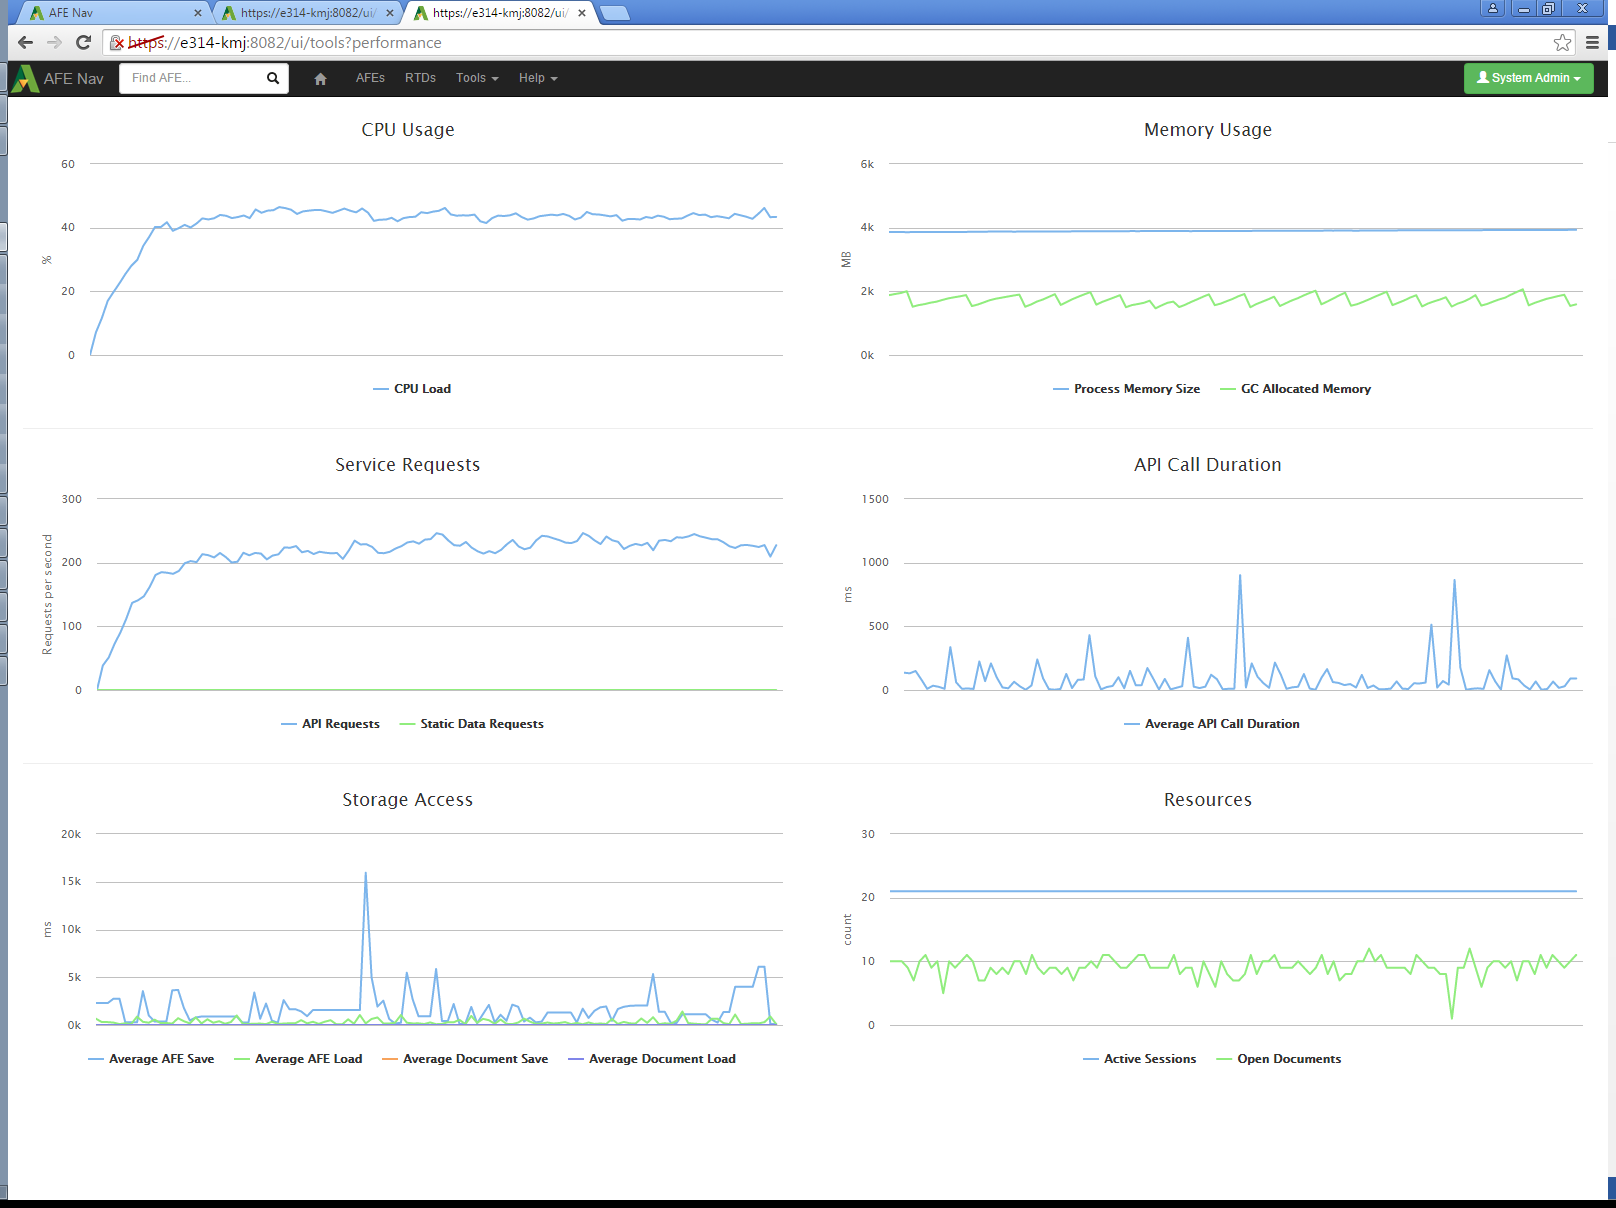
To try and reach an upper limit of performance, 4 instances of each workload script were run simultaneously (16 total streams of requests). The API call rate reached 225 requests per second and the CPU load reached 45%.

Click image to expand or minimize.
Increasing the number of workload scripts to 20 did not cause a noticeable increase in the request rate.
Click image to expand or minimize.
Test Analysis
The test scripts were able to reach a peak rate of 225 requests per second at a CPU load of 45%. Memory usage remained stable at all loads. The limited CPU usage indicates that the test setup was waiting for network or database access. The server performance in requests per second should increase if those bottlenecks were addressed.
Comparison to Expected Real User Activity
The average size of the simulated user actions is 26 requests each. However, the workload scripts are expected to cause more load on the server than real user activity. Real users will not typically need to load all the data on an AFE at once. The scripts perform an “AFE Open” and “AFE Close” call for each request, while users performing updates to the AFE will access the server more than once for the same open AFE, and only cause requests as they finish interacting with UI elements, not continuously. Real user actions can be expected to require fewer requests, but the 26 request per action value will be used as a conservative upper limit.
At 26 requests per action, the service being tested was processing the equivalent of 519 actions per minute. As discussed in the test analysis, this is not the maximum possible performance of the tested configuration, but it will be used as a lower limit for performance.
An approximation for the average activity of a user can be made. Assume there are 2 types of users, ones who edit AFEs, and ones who view them. A representative database has 17% of users as AFE creators who would be editing AFEs. Assume that a user editing AFEs performs 3 actions per minute, and a user viewing AFEs performs 1. The average actions per minute for an active user would then be 1.34.
For these assumed average users, at 519 actions per minute, the service was handling the equivalent of 387 active users.
Not all connected users will be active at the same time. Inactive users have a small impact in terms of memory and service requests. The number of connected users for a server can be expected to be even higher than the 387 active users.
Conclusion
The tests did not determine a maximum performance for the test system. The simulated load is estimated to be equivalent to 387 active users, but the server itself was using only 45% CPU time. A real Aucerna Execute deployment would not be operating under the constraints of the test system and could be expected to use more server resources.
This test has verified that the Aucerna Execute service is capable of responding to a level of requests equivalent to hundreds of simultaneous users when run on a basic desktop PC. It has also confirmed that performance improves with multiple CPU cores. The assumptions made are for the test are generally conservative, so performance with actual users is expected to be comparable.