
Reporting Options
Click image to expand or minimize.
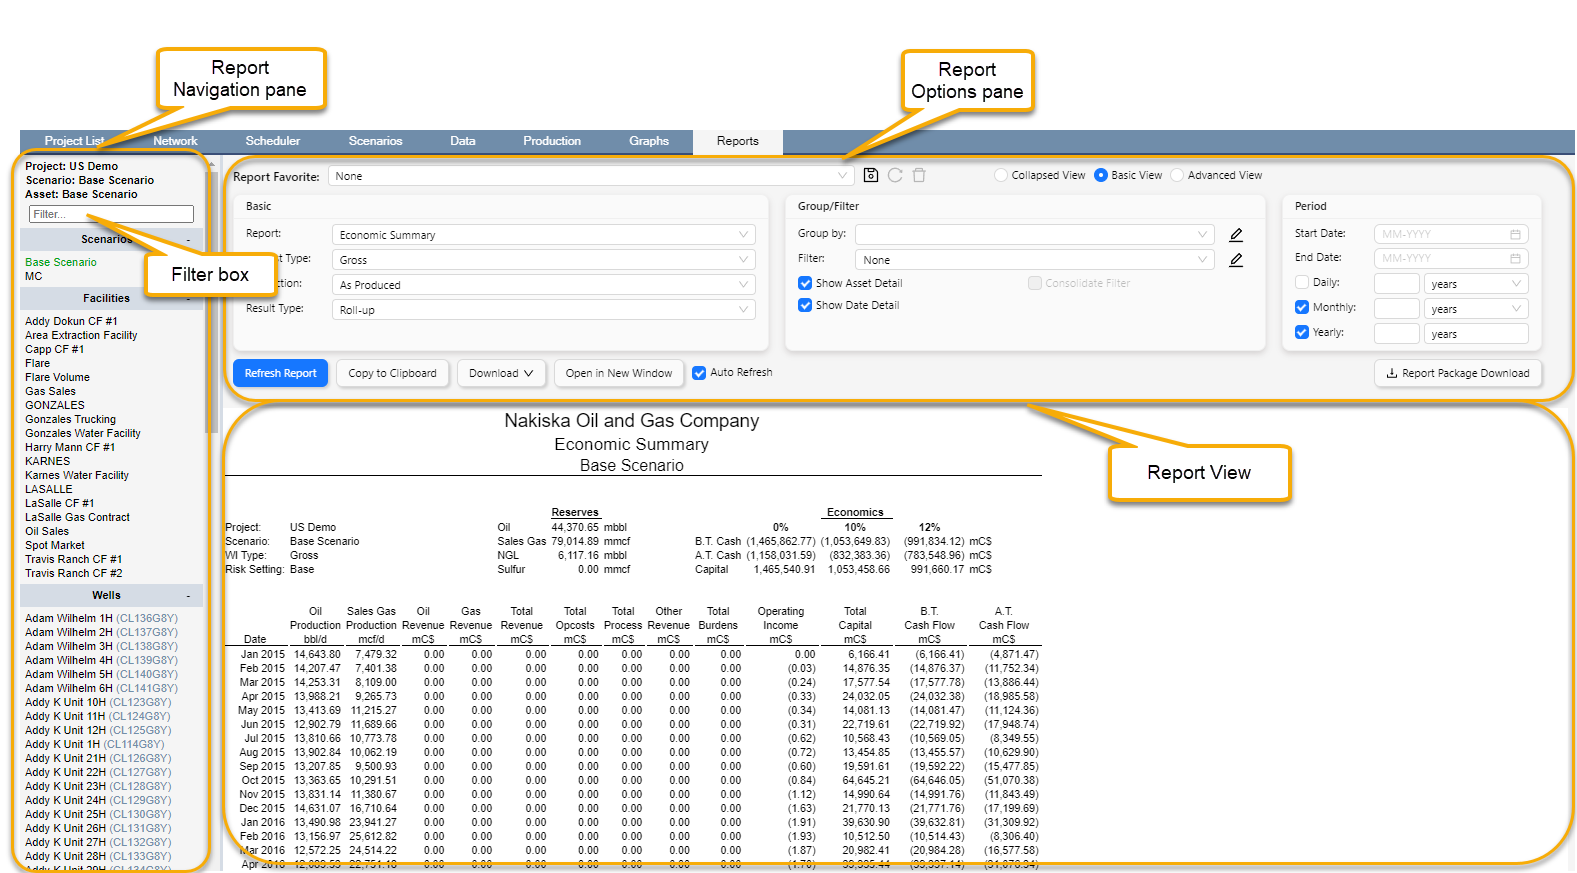
Navigation Pane
The Navigation pane contains a list of scenarios, facilities and wells. When choosing a scenario, the navigation pane will automatically show only the facilities and wells pertaining to the scenario.
Filter Box
Used to filter the list of scenarios facilities and wells to view results for specific assets.
Report Option Pane
The Report Option pane provides the user with many options to view and organize results for analysis.
Report Favorite
A Report Favorite is used to quickly load a saved configuration of a specific report and report settings. Use the Save icon to save changes to the selected Favorite or to create a new Favorite and use the Reload icon to reset the settings to the selected Favorite.
.png)
Click image to expand or minimize.
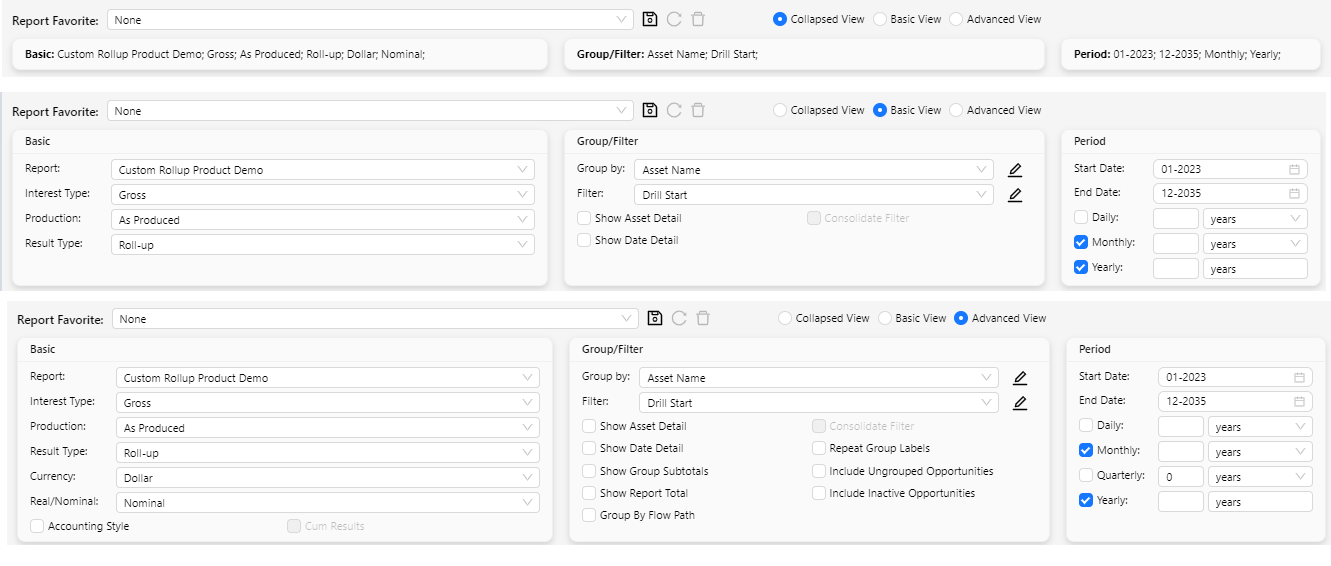
View Options
As of Enersight 2.17, there are three view options on the Reports tab: Collapsed View, Basic View, and Advanced View.
- Collapsed: shows a short summary of the selected settings. Report options cannot be edited in this view.
- Basic: shows the most commonly used report options.
- Advanced: shows all of the report options available.
Click image to expand or minimize.
Basic Report Options
- Report: Contains a list of standard and custom reports built by the administrator (see Report Designer)
- Interest Type: Filters viewed report reflect results as “Gross”, “WI”, or “Net”.
- Production: Filters report to show results either “As Sold” or “As Produced”
- Result Type: Views the results as either “Roll-up” or “Incremental”. The difference being that:
- The roll-up is the cumulative result of the asset and all other assets flowing into that asset.
- The incremental is the calculated result of the single asset.
For example, consider a well flowing into a facility where the well provides a revenue and the facility is generating revenue from oil processing:
- The cumulative result at the facility is the sum of the wells revenue and facilities revenue.
- The incremental revenue is the solely due to the revenue generated by the facility.
- Currency: Defines the currency of the report defined by the user
- Real/Nominal: Displays the report in real vs nominal values which are defined by the user (see Real/Nominal)
- Accounting Style: Displays reports in accounting form
- Cum Results: Displays all columns as cumulative values
Group/Filter Options
- Group by: reports can viewed by groups by selecting an existing report group in the dropdown. Click the edit icon next to it to edit or add new Report Groups.
- Filter: reports can be filtered by selecting an existing filter in the dropdown. Click the edit icon next to it to edit or add new Filters.
- Show Asset Detail: will display data in the report for each asset in the Report Group.
- Show Date Detail: will display data for each date in the Report Group.
- Show Group Subtotals: will display subtotals on the Report for each Report Group.
- Show Report Total: will display a Report Total when a Report Group is selected.
- Repeat Group Labels: repeats the Report Group label on every row.
- Include Ungrouped Opportunities: will display Wells/Facilities that are not in a valid Report Group.
- Include Inactive Opportunities: will display Wells/Facilities that have values of 0 for the selected Report and Periods. Otherwise, these opportunities will be hidden from the report.
- Group by Flow Path: see Advanced Grouping Options – Group by Flow Path
Period Options
Reports can be configured to be a specific period of time using the Start Date and End Date inputs and can be a combination of different periodicities. Reports will be displayed starting from the most granular periodicity to the least granular (e.g., daily rows will be displayed before monthly or yearly). Results can be displayed daily, monthly, quarterly or yearly by toggling the period box. The report will update according to the user-defined duration for each periodicity selection. If no duration is specified next to a periodicity, the entire (or remainder) of the report will be displayed in that periodicity. For example, if Daily is selected with a duration of 1 year and Monthly is chosen with no duration, the report will reflect 1 year of daily data followed by monthly data.
Report Actions
- Refresh Report: refresh the data for the currently selected report and report options.
- Copy to Clipboard: copy report data to the clipboard for pasting into excel. Ctrl+C can also be used.
- Download - Clear Cache: clears the report cache.
- Download - Generate for Download: opens a window where reports can be generated to various file formats.
- Download - View Cache: provides a list of previously viewed reports that have been cached. These reports have been stored and can be downloaded.
- Open in new window: opens the current report in a new browser window. Reports can be 'printed' to pdf from this view.
- Auto-refresh: when checked, reports will refresh automatically when a new asset is selected or when any Report Options are changed.
- Report Package Download: allows you to define a package of reports to download in bulk as Excel files. See Report Package Download for more info.