
Using the Network tab to report, is probably one of the best ways to understand what is happening with your project. As this method uses the network as its backdrop, it is also a great way to collaborate on a project.
All of Enersight's reports are available by right-clicking on an entity on the network tab. Changing the selection on the "Right Click Report" dropdown, will allow you to select which report you wish to see. Graph: Decline is probably the most common, but all of the economic's reports are also available.
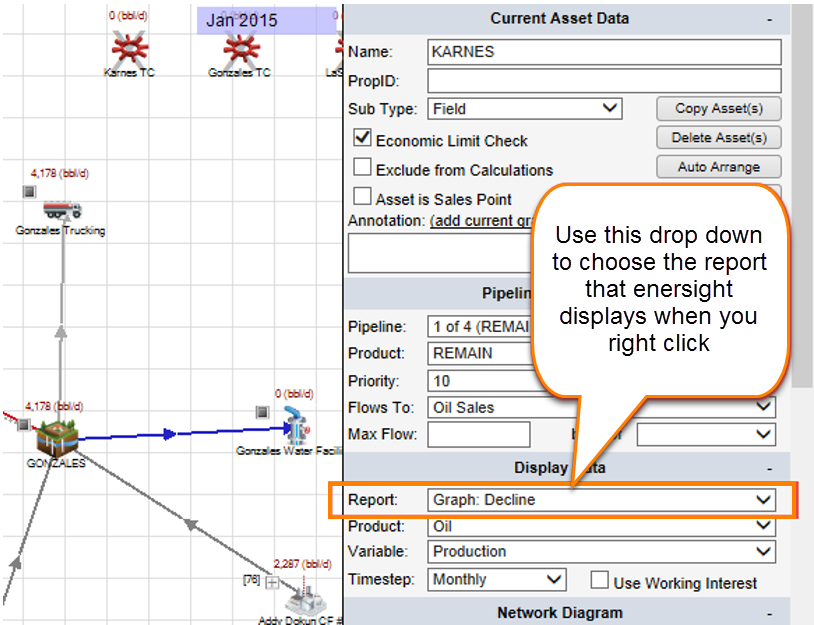
Click image to expand or minimize.
The following figure is an example of the Graph: Production Details as the right click report.
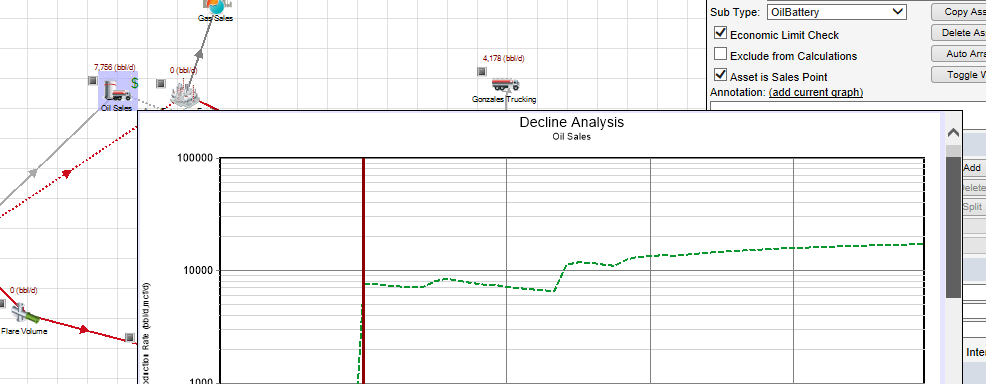
Click image to expand or minimize.
The following figure is an example of the Economic Indicator as the right click report.
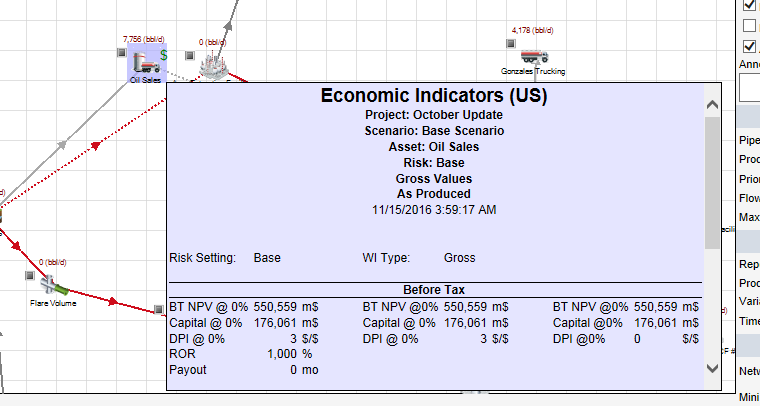
Click image to expand or minimize.