
Settings, Filtering and Exporting from the Gantt Chart
Display Settings
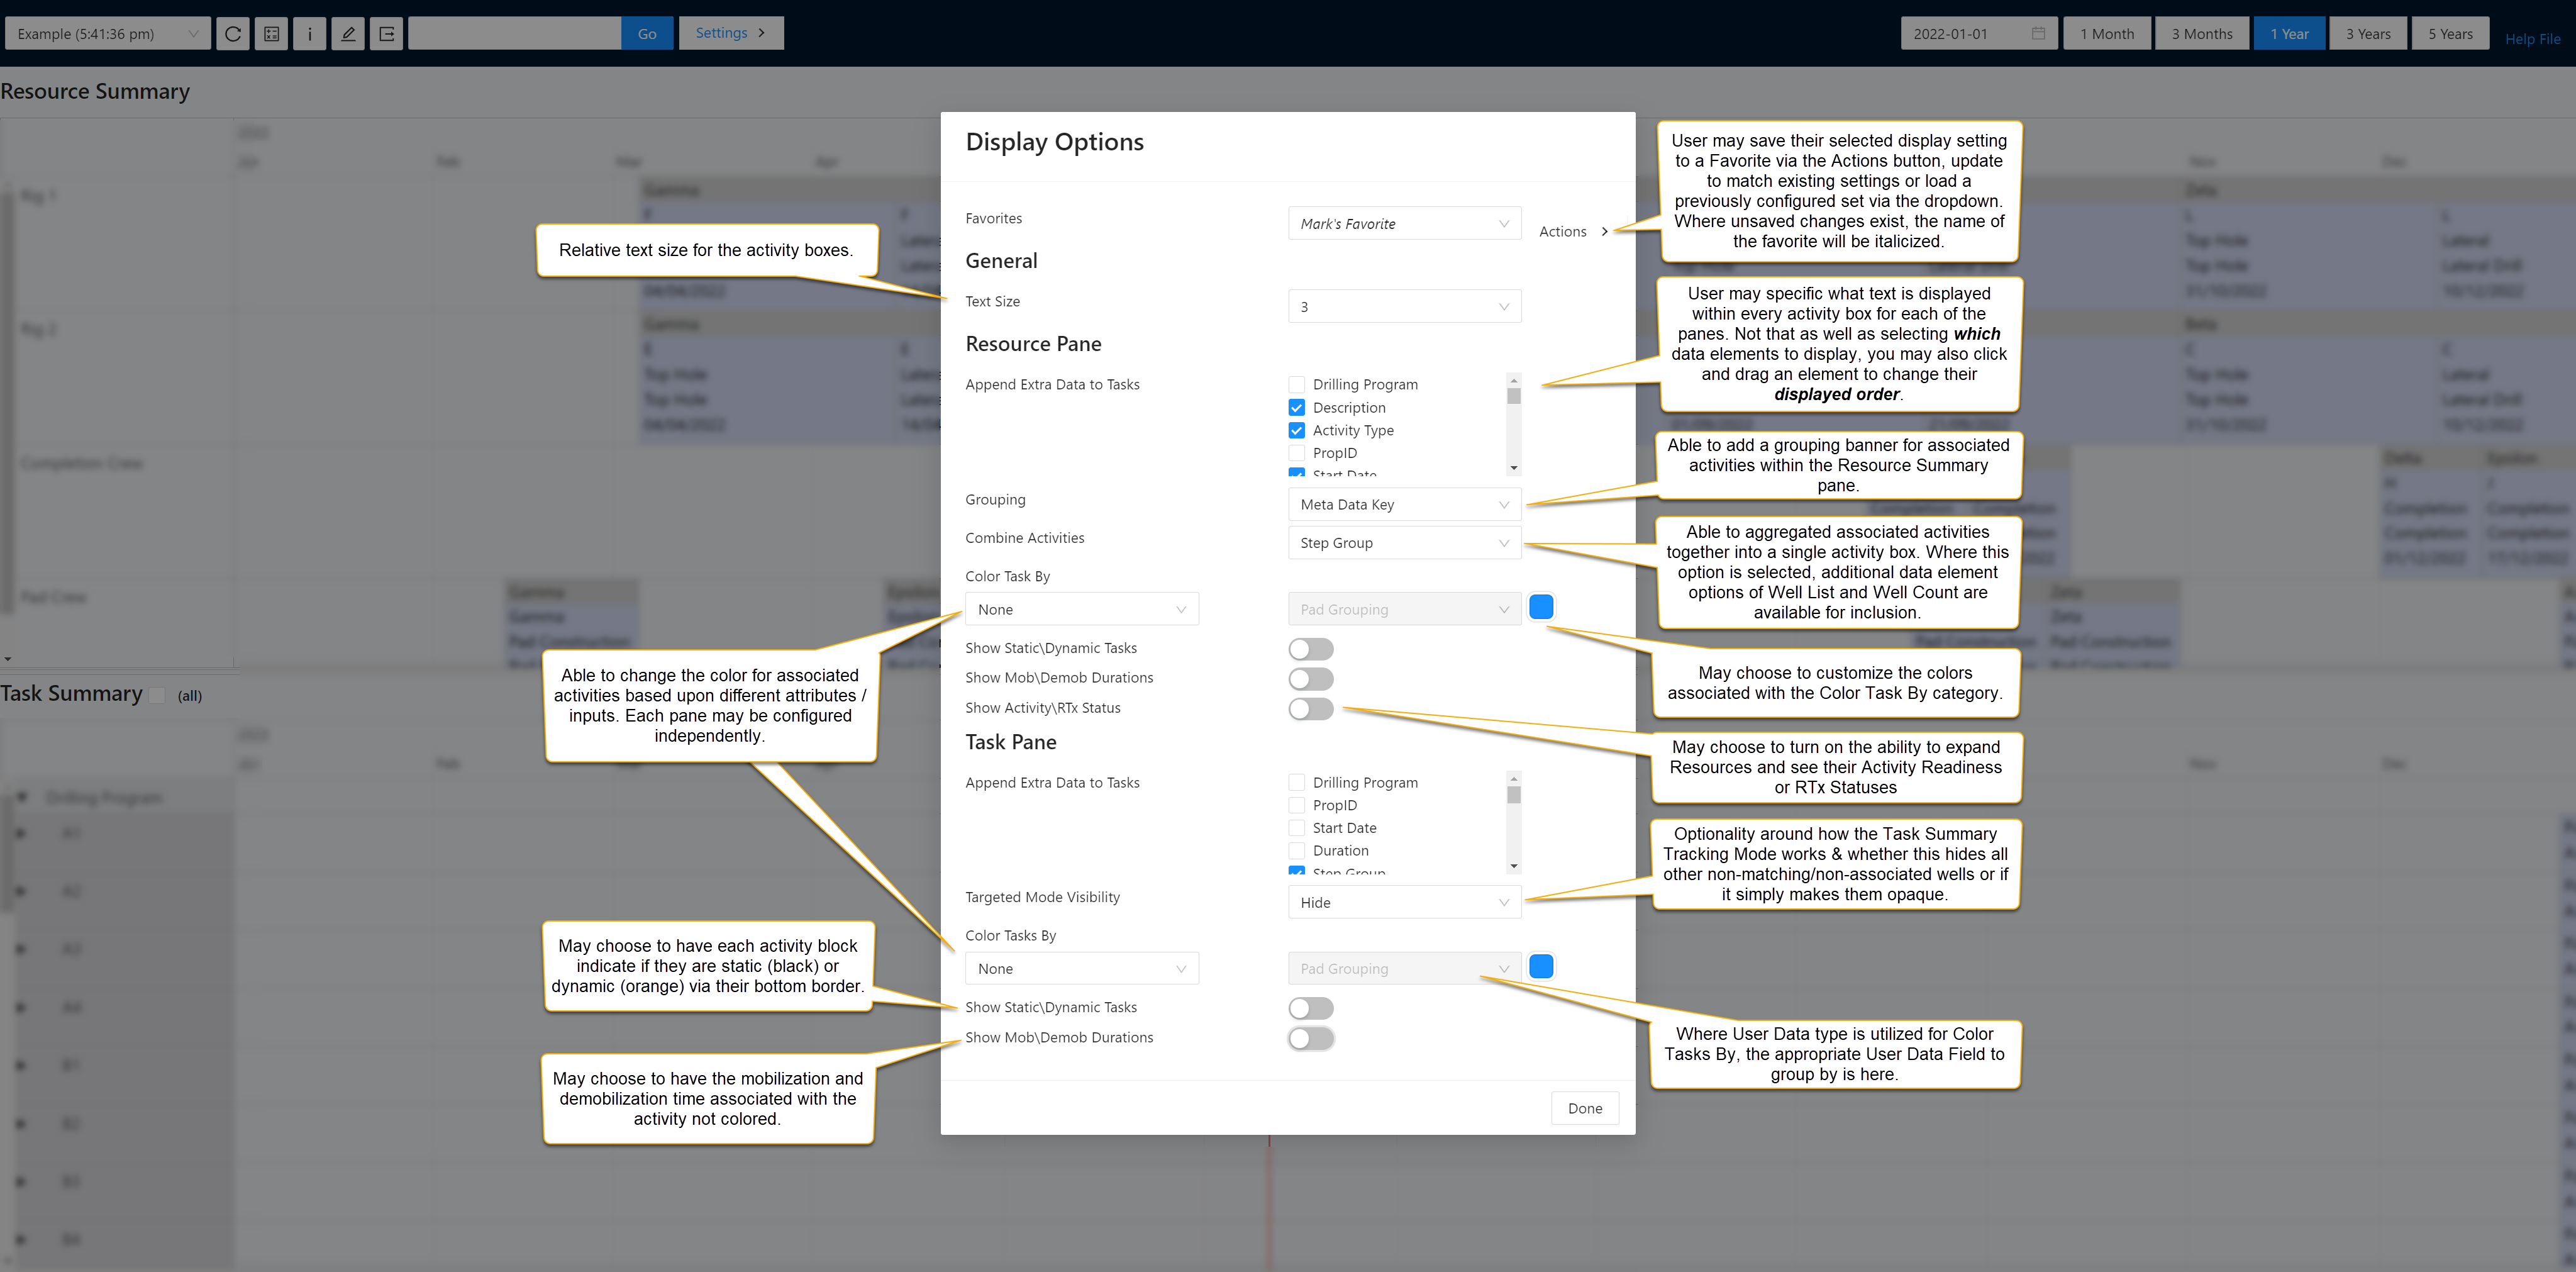
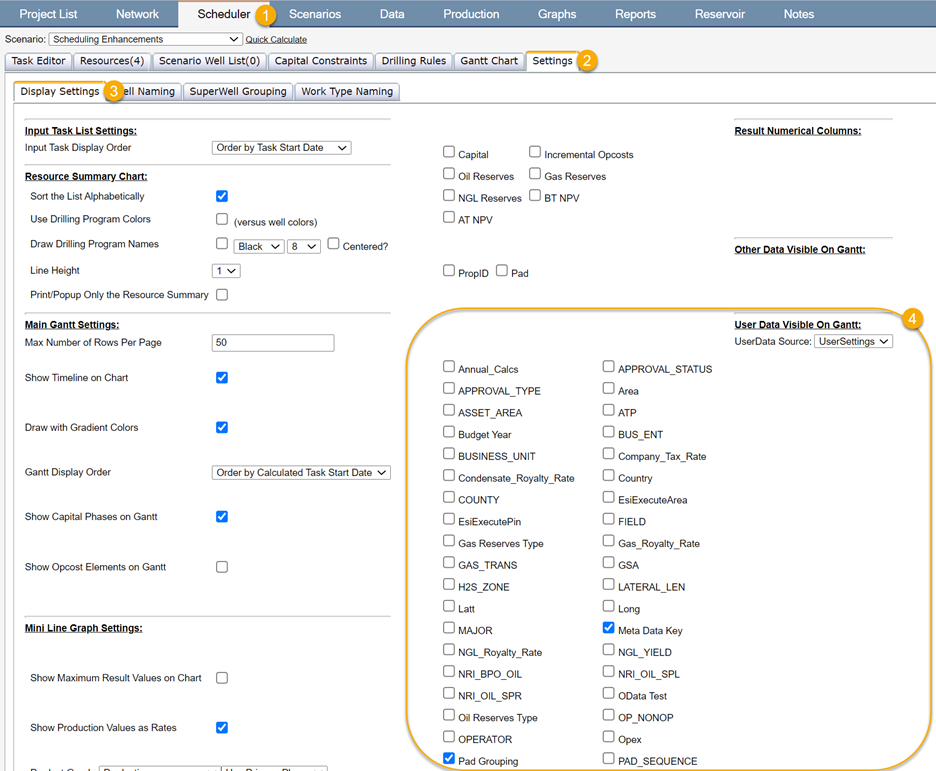
Under the Settings option, you may select Display Settings in order to customize how activities are represented within the Gantt Chart, as well as what text is displayed. These inputs may be saved and sharedas a favorite to your entire company or any users of your project. When opening the Gantt Chart, the last utilized favorite will be pre-selected.
Click image to expand or minimize.
Click image to expand or minimize.
Displayed Text within Activity Box
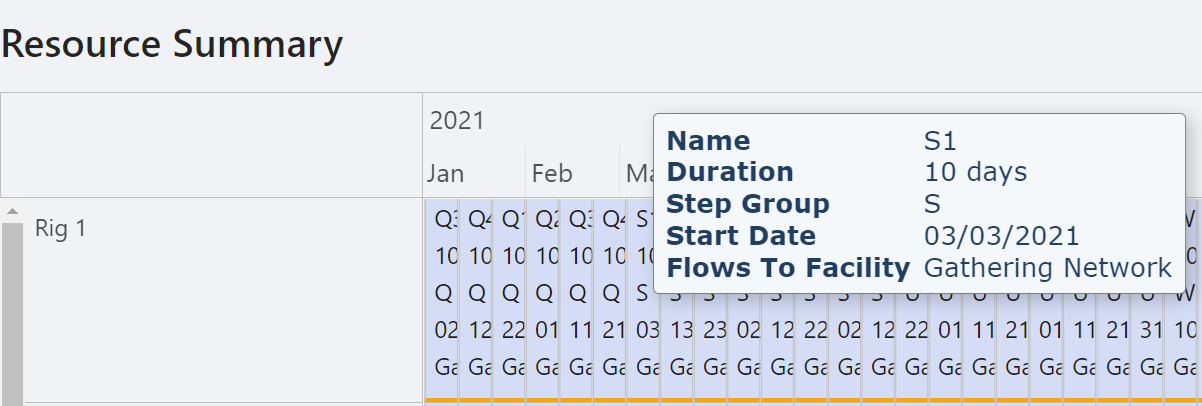
Displayed text for each of the Resource and Task Summary Panes may be configured independently under the ‘Append Extra Data to Tasks’ section for each component. This allows for both adjusting which data elements are added to the default inputs of Well Name in the Resources Summary and Step Description in the Task Summary. The sequence of these inputs may also be adjusted via left clicking on the text option and dragging up or down within the list.
The displayed text size may be relatively adjusted via the dropdown to match your specific needs given window size, browser zoom and screen size.
Click image to expand or minimize.
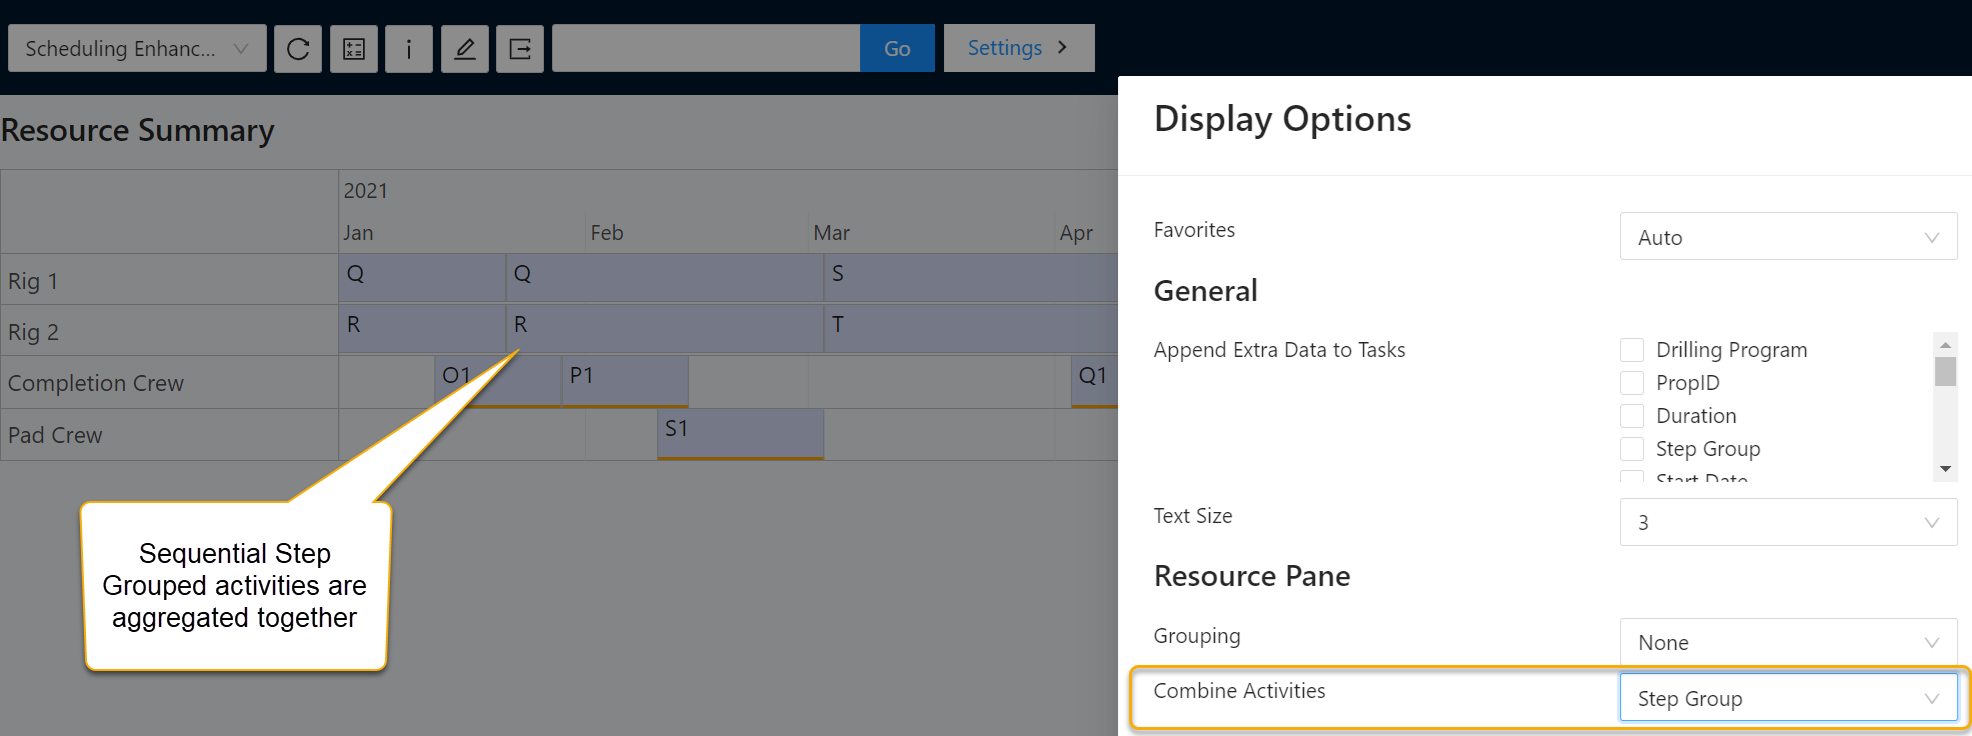
Where you are zooming out to such an extent that it is not legible, we recommend that you use the Combine Activities option to group the activity boxes together within the Resource Summary Pane. When this mode is selected two additional text options of Well List and Well Count may be included and the previously text of Well Name will be replaced with the element you are combining on.

Click image to expand or minimize.
Task Summary Tracking Option
The behavior for how the Tracking options works within the Task Summary when selecting activities on the Resource Summary is managed via 'Target Mode Visibility' with options of Hide or Opaque available. Refer to the section above on the Task Summary Selection option within Using the New Gantt Chart.
Resource Summary Pane Grouping Options
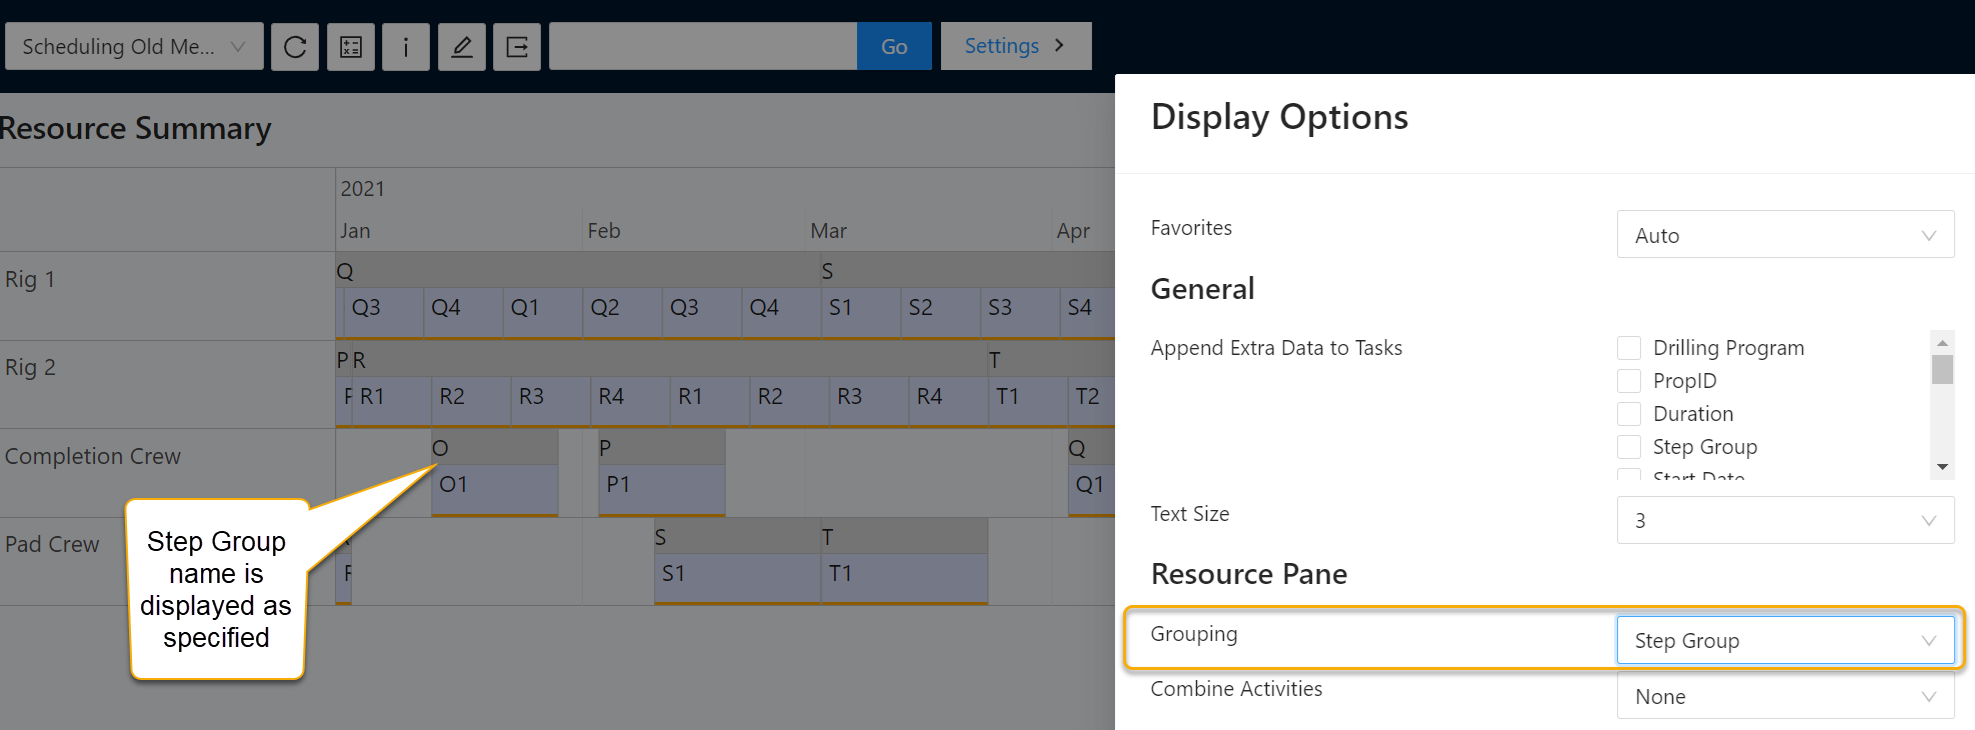
Within the Resource Summary, you may choose to group associated activities based upon shared attributes and/or combine activities alike together. This first grouping option enables a shared banner to be displayed above the activity, including the inputted attribute in which it is grouped. Note that if there is unutilized space on the resource between two activities and they are both part of the same grouping, the banner will persist over the gap. In the second case, the activity blocks themselves are combined to assist in ensuring sufficiently wide boxes to display data over longer horizons. In this case, the inputs do adjust slightly to have aggregated values where appropriate.
Click image to expand or minimize.
Click image to expand or minimize.
Colors, Activity Status and Mobilization/Demobilization
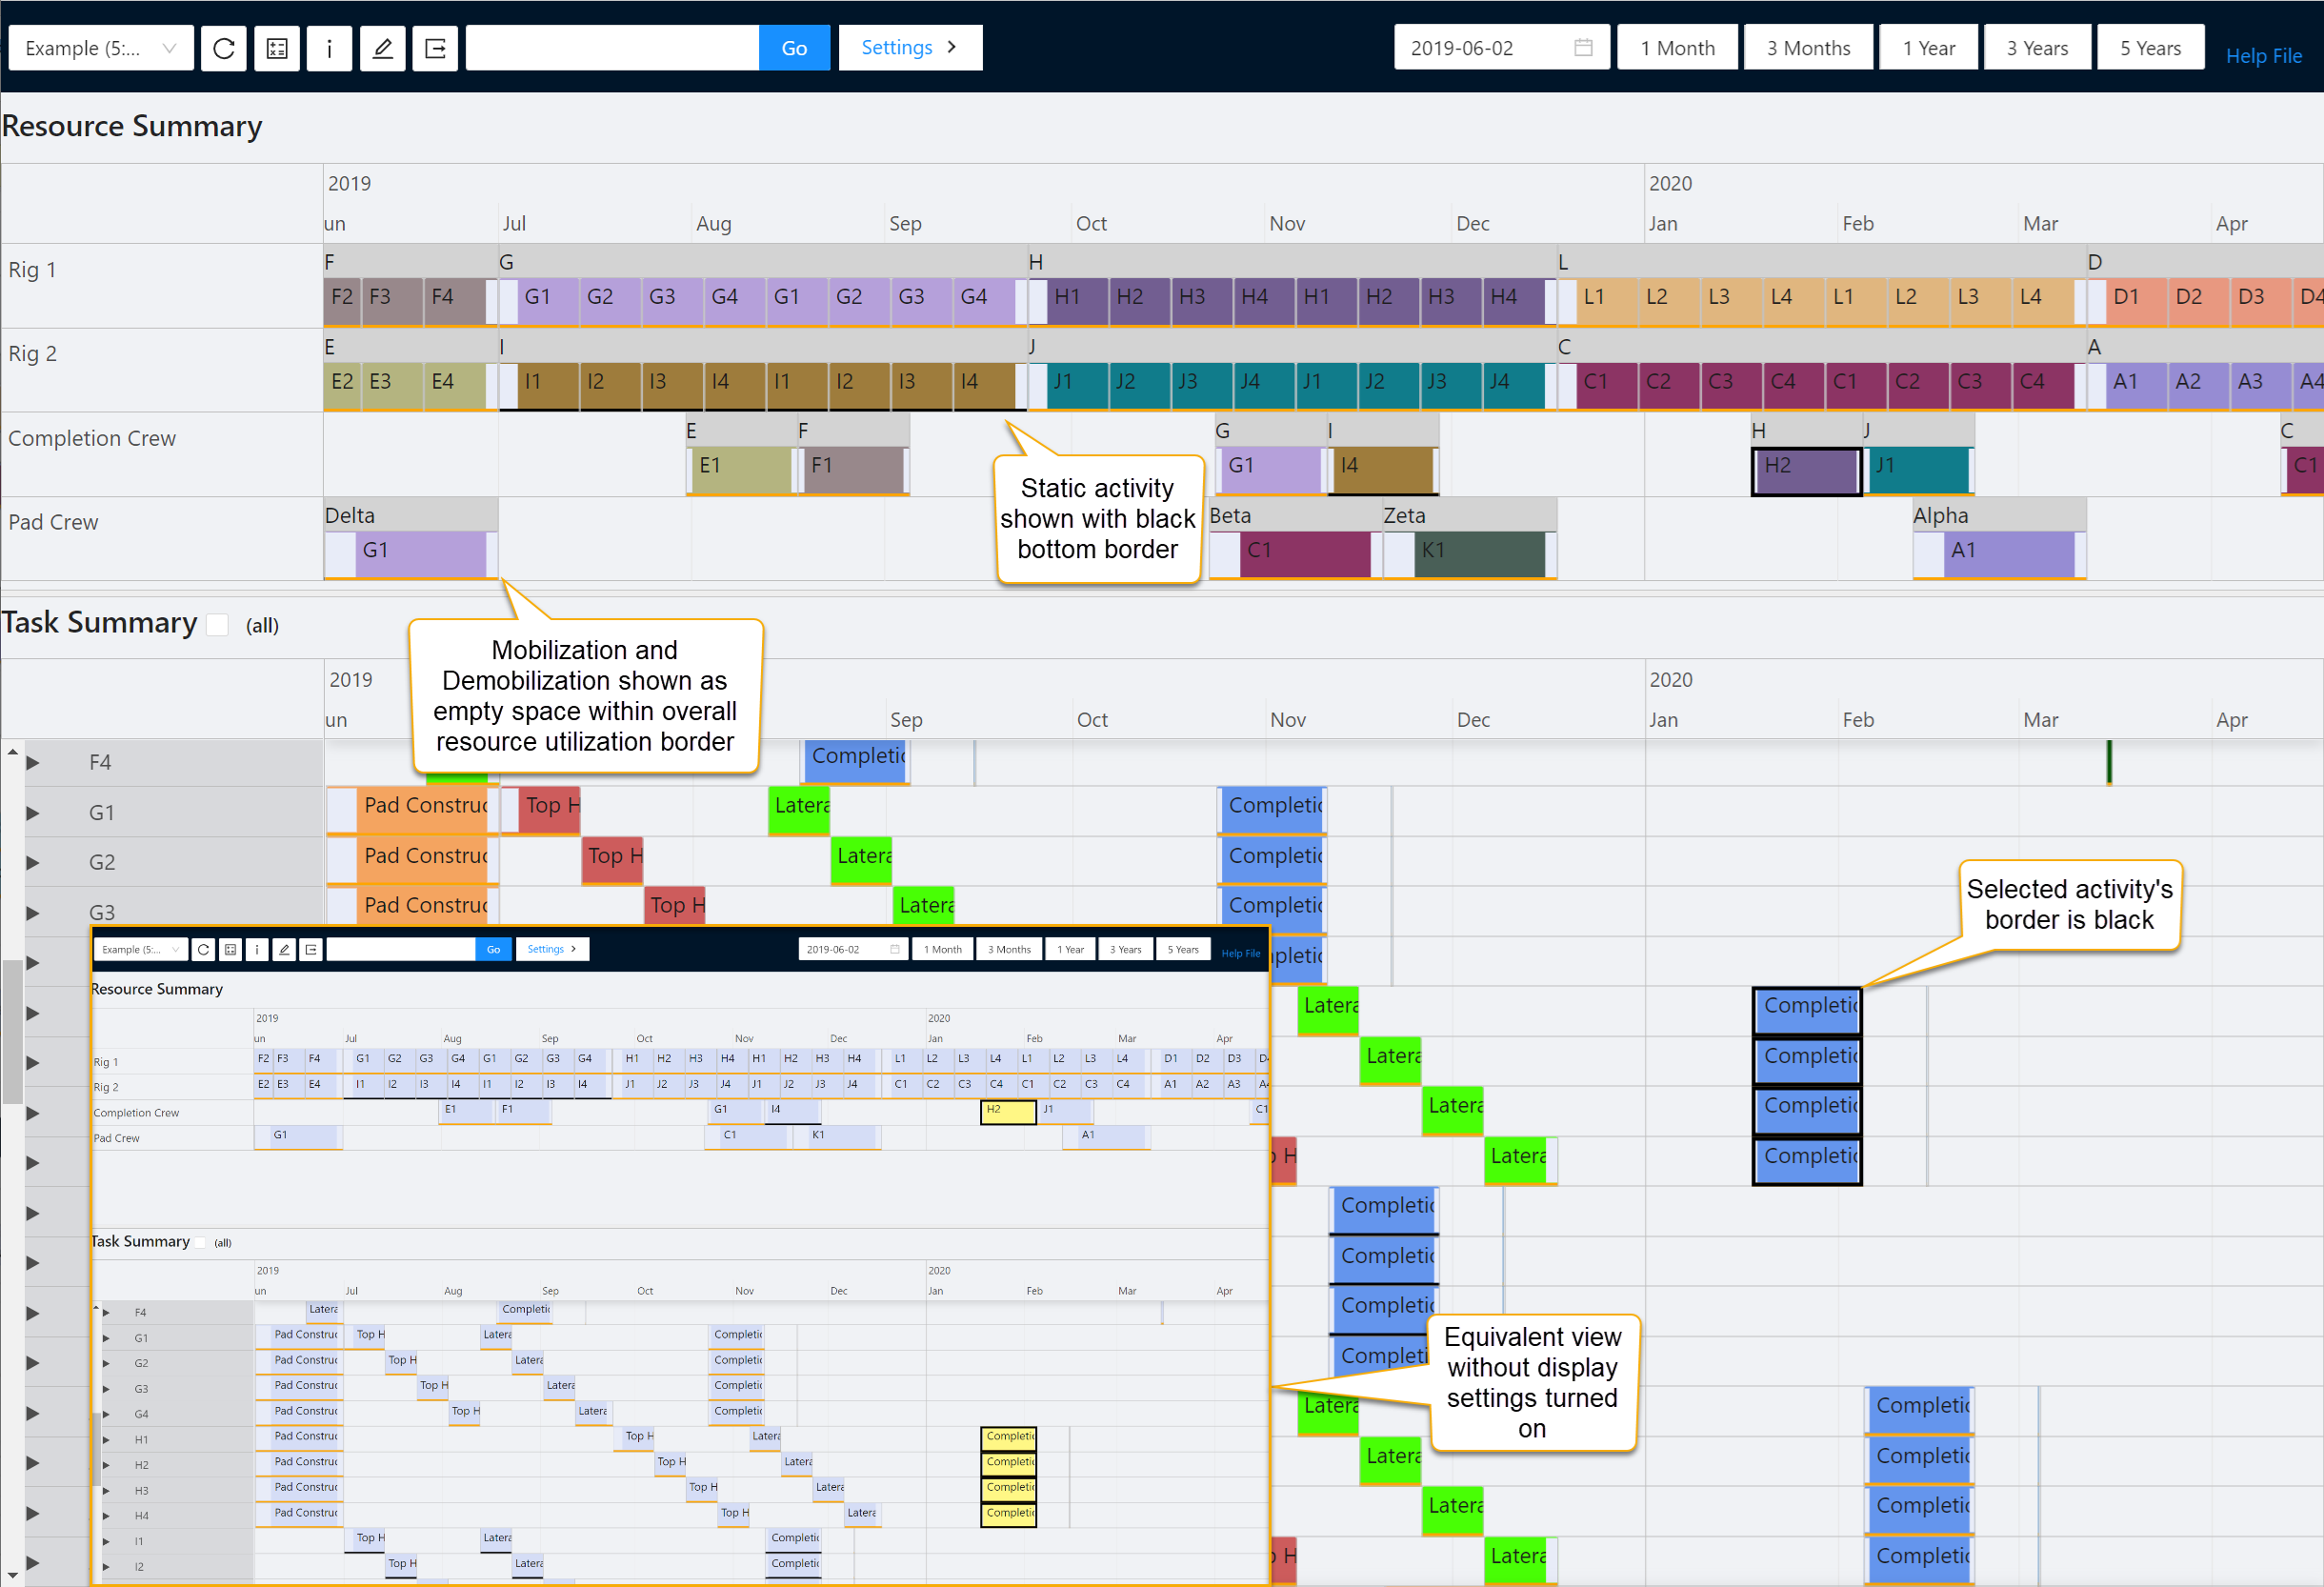
Each pane may be configured independently to how it is colored, whether mobilization and demobilization are shown separately to the actual work of the activity and if there is an indication of the activity’s status (Static/Dynamic).
Click image to expand or minimize.
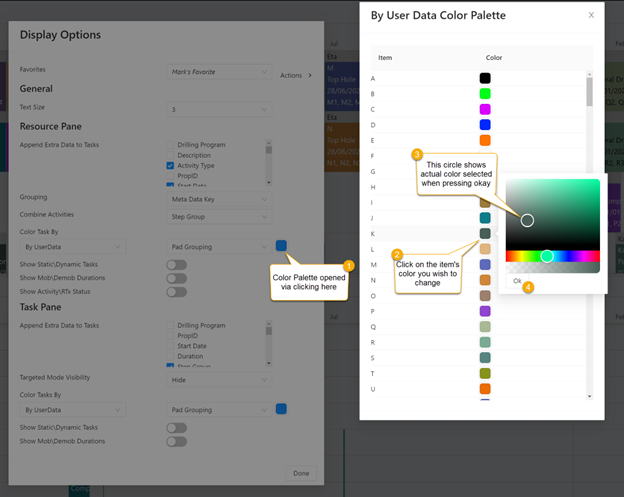
The colors utilized may be customized via the Color Palette. These adjustments are included in the Favorites on save.
Filtering
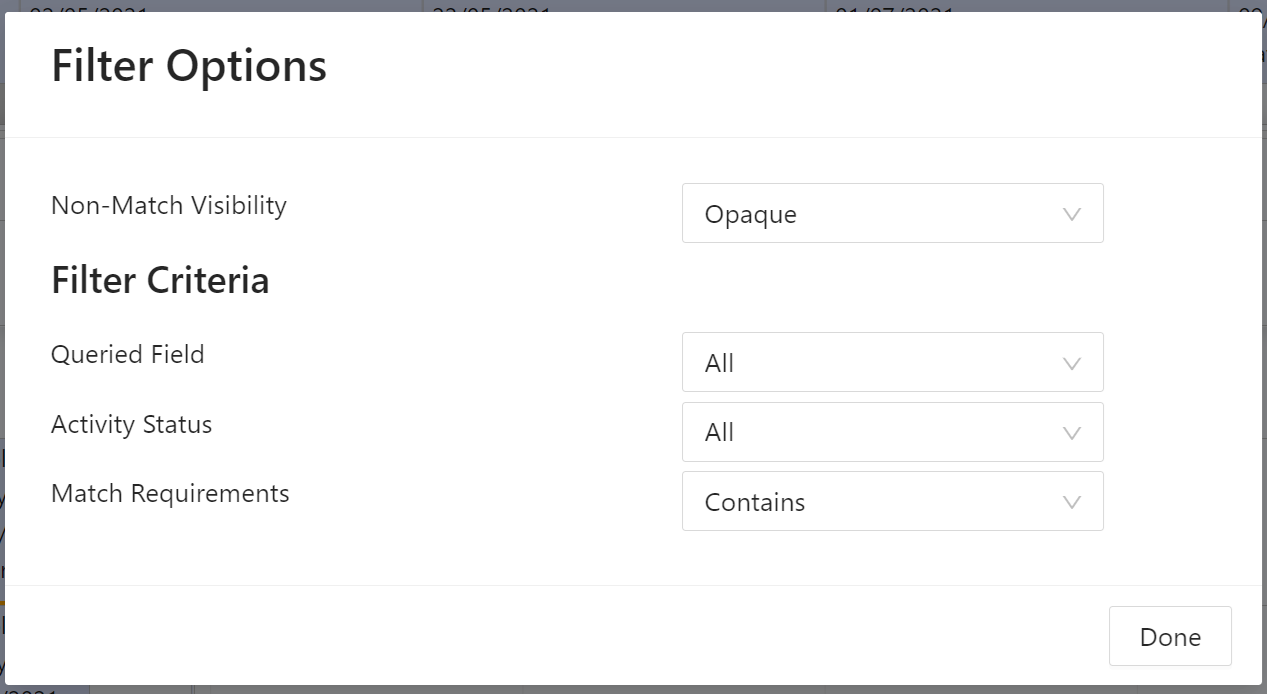
In addition to manually changing pane sizes or scrolling to interesting areas of the Gantt, there is an option to filter what is shown and easily highlight certain details. Specifically, the Gantt has the option to enable non-matches to be hidden entirely so you can focus without distractions or simply make these other activities opaque so as to keep the context of other activities and the overall utilization of resources available during analysis.
In terms of filter criteria, you also have options to evaluate on the basis of:
- Activity Status (Static / Dynamic)
- Field match requirements (Contains, Equals, Begins with, Ends with)
- Queried Fields to be evaluated within the query
Click image to expand or minimize.
Through using the filter, you may readily change the display to only include certain activities, or resources to personalize to your current ad-hoc requirements.
Exporting to Excel
In addition to being able to view and interact with the Gantt within the main window, the currently selected time horizon may be exported to Excel via the button in the top menu shown below:
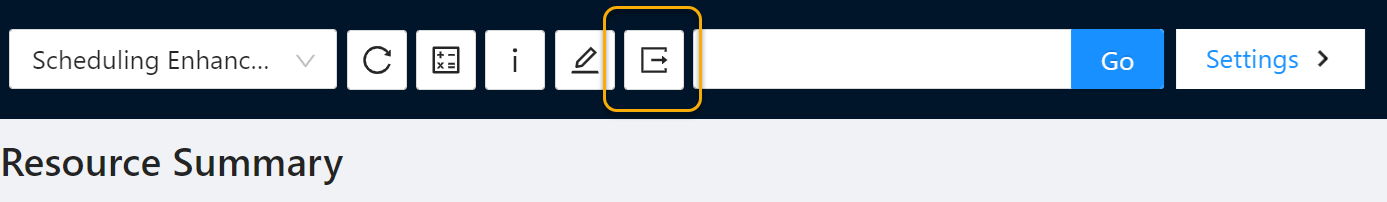
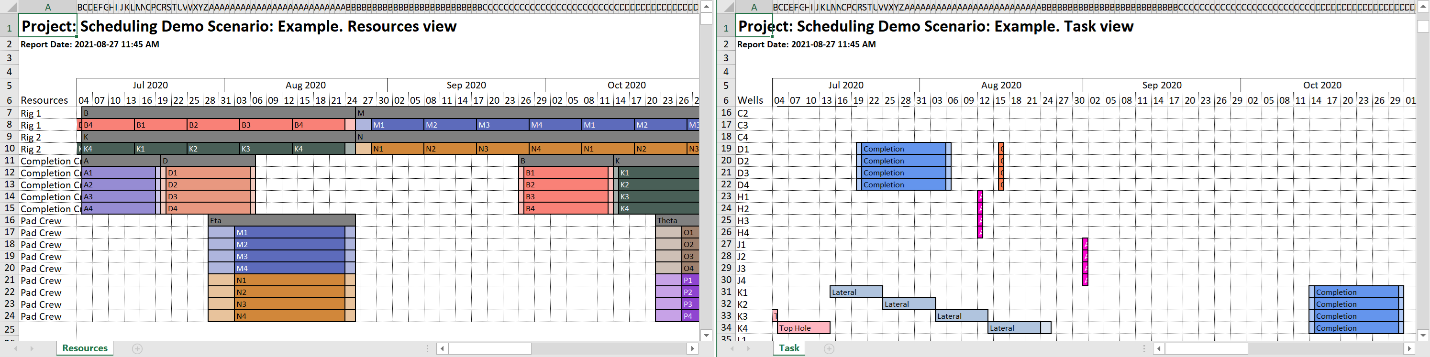
This results in two Excel files being generated, one for the Resource Summary and the other for the Task Summary. These files reflect the settings of the display, including coloring and mob/demob as well as grouping.
Click image to expand or minimize.
2. The granularity of the Excel exports changes depending upon the horizon selected for export. As a minimum limit each column represents 3 hours when a horizon of 31 days or less is displayed, else 2 days per column is utilized when the horizon extends above this.
Under Settings > Export there is additionally an option to change the page size on the export for later printing if desired or adjust the default settings to enable exporting all tasks from across the entire calculated horizon in one file.
Activity/RTx Status
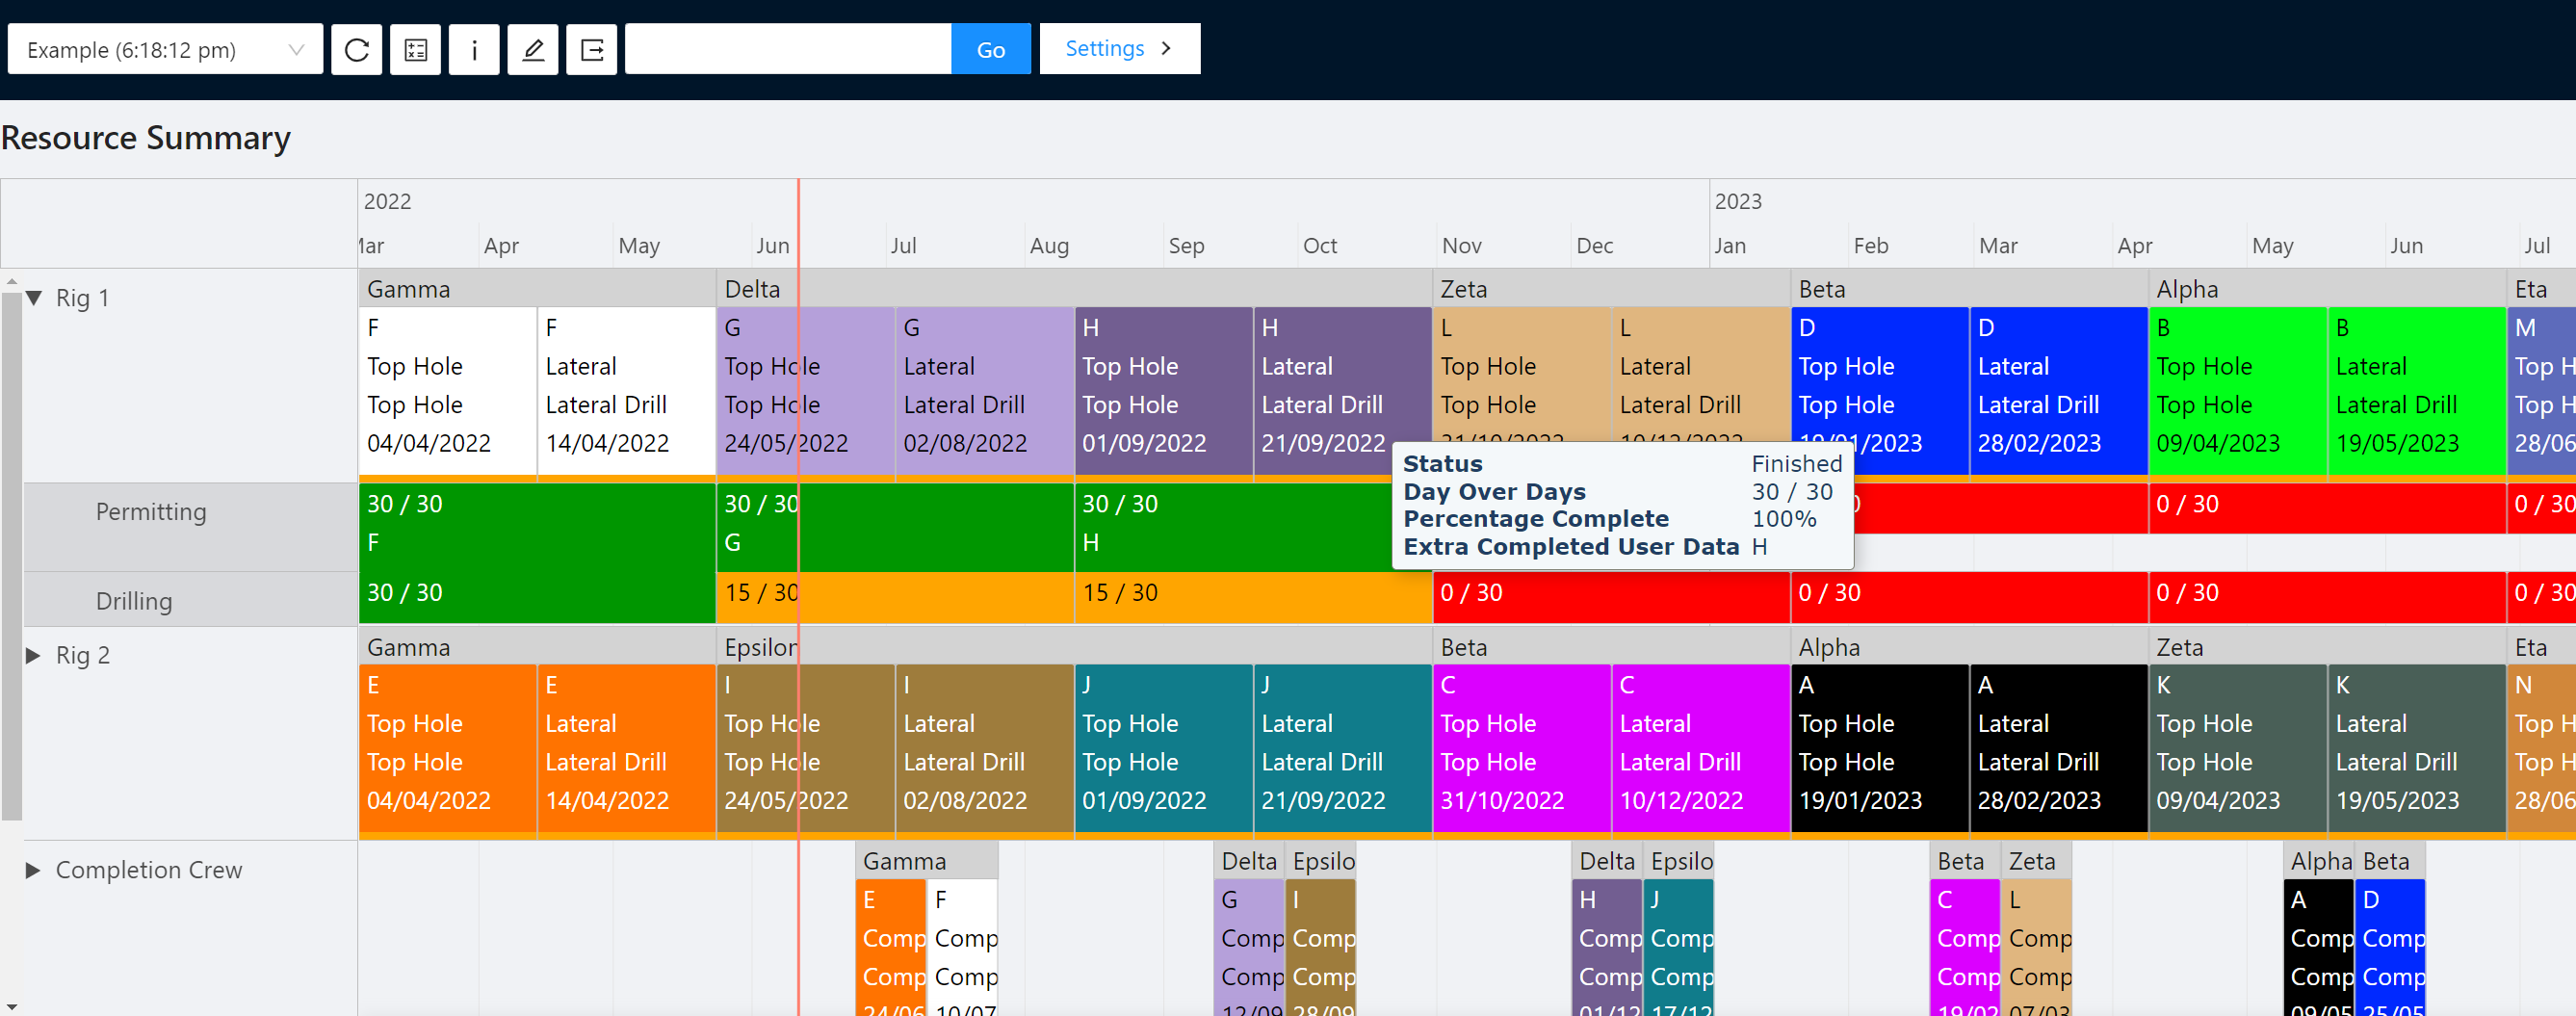
The ability to expand resources to see the activity's RTx status may be enabled via the Settings > Display options. Once enabled, you can choose to expand out a resource.
Click image to expand or minimize.
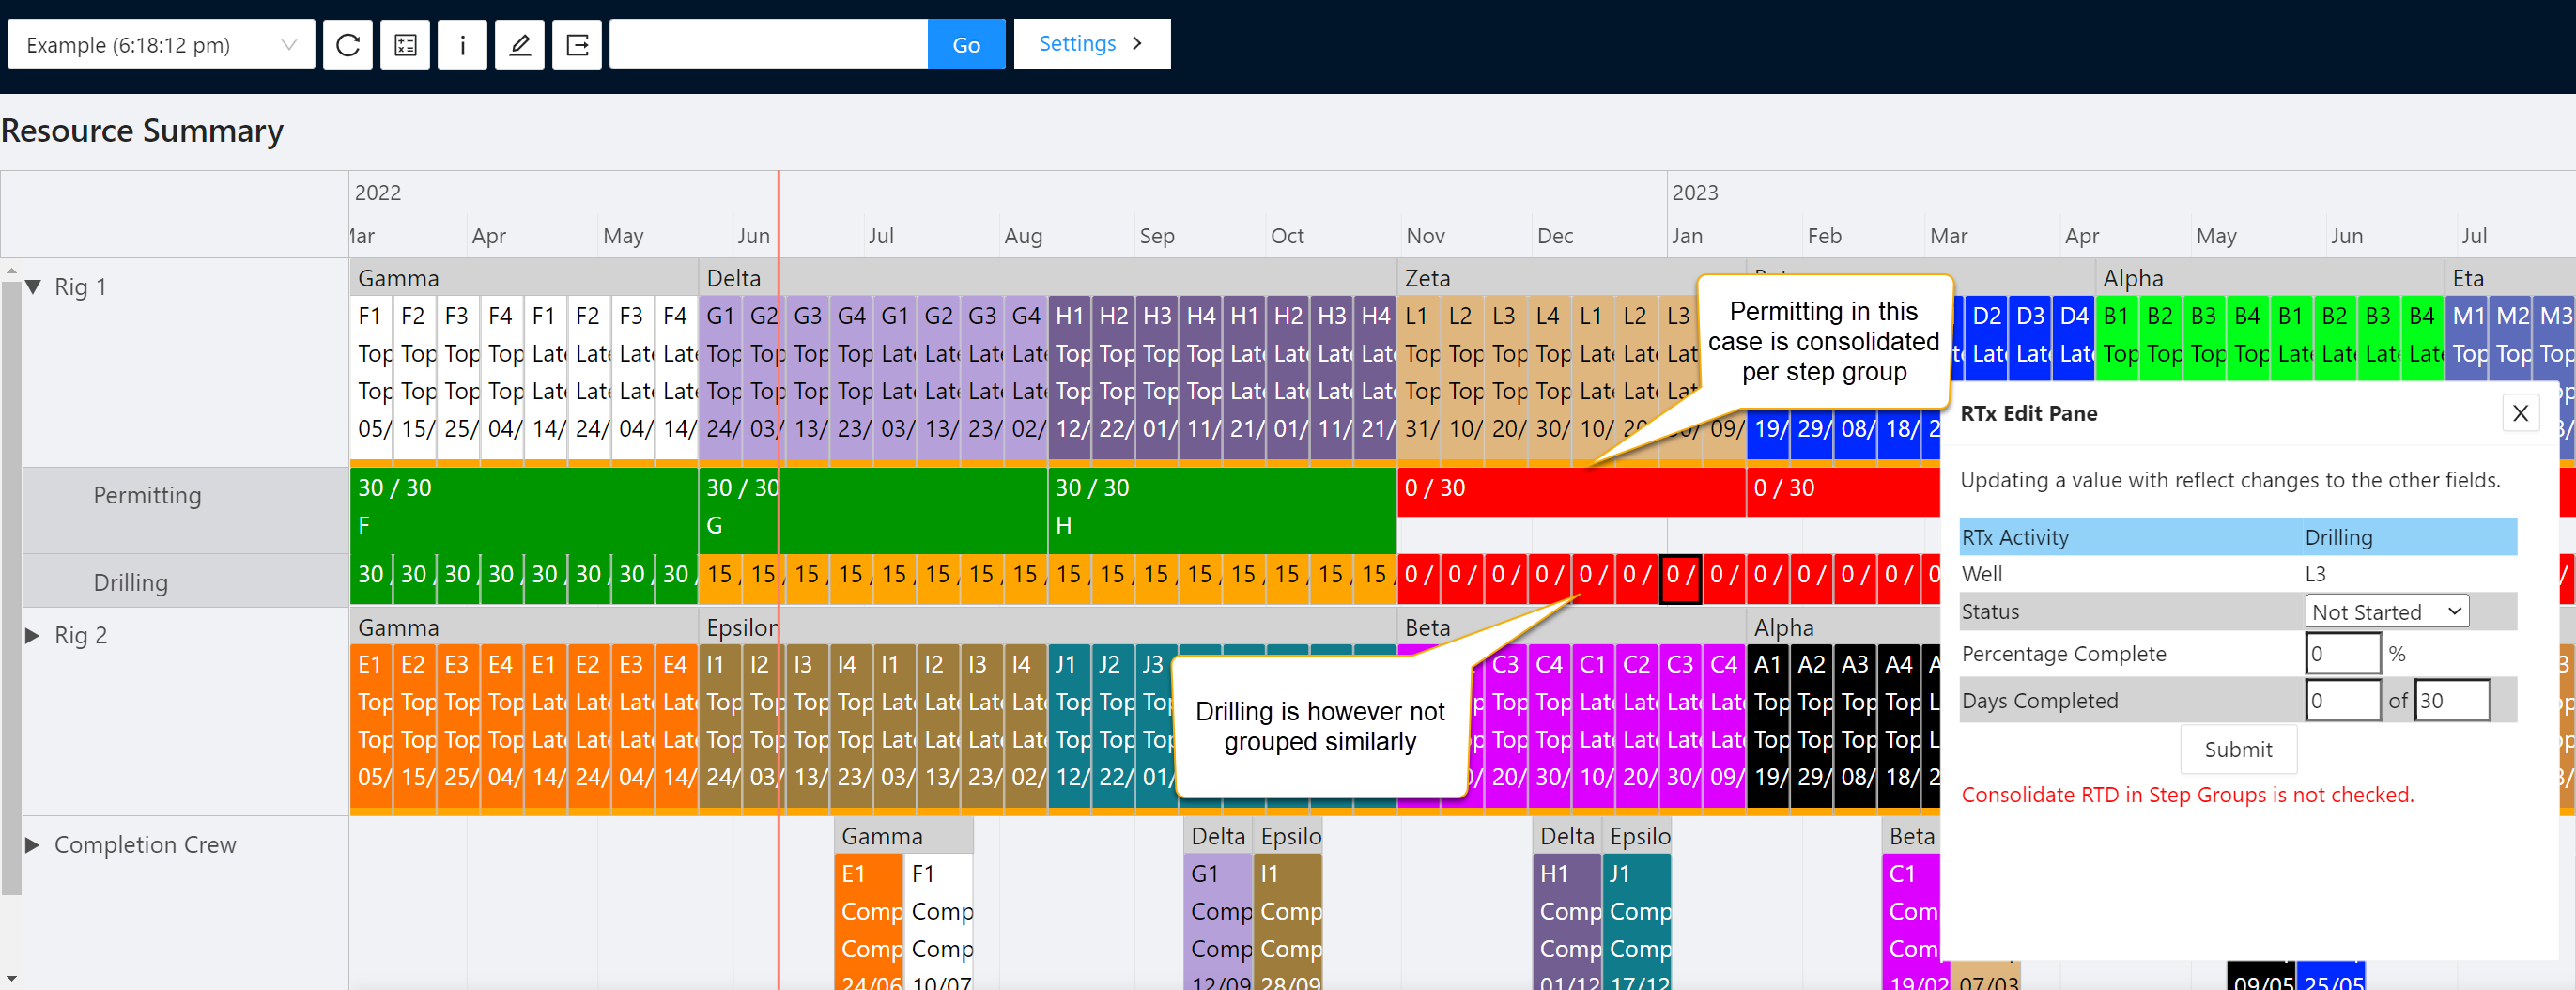
You can then see the status per color and days of days completed as well as any user data you may have associated with the activity either being completed or incomplete. Where activities are combined in the Gantt a single box will be shown spanning the aggregated activities with the worst status displayed. Where in Scheduler > Settings > Work Type Naming you have not selected that RTD is consolidated in Step Groups, individual boxes are shown with an appropriate warning.
Information and Editor Pane
In addition to being able to configure a set of inputs to be visible for all activities, you may also bring up a Well Info pane that enables all attributes to be displayed for a single selected activity.
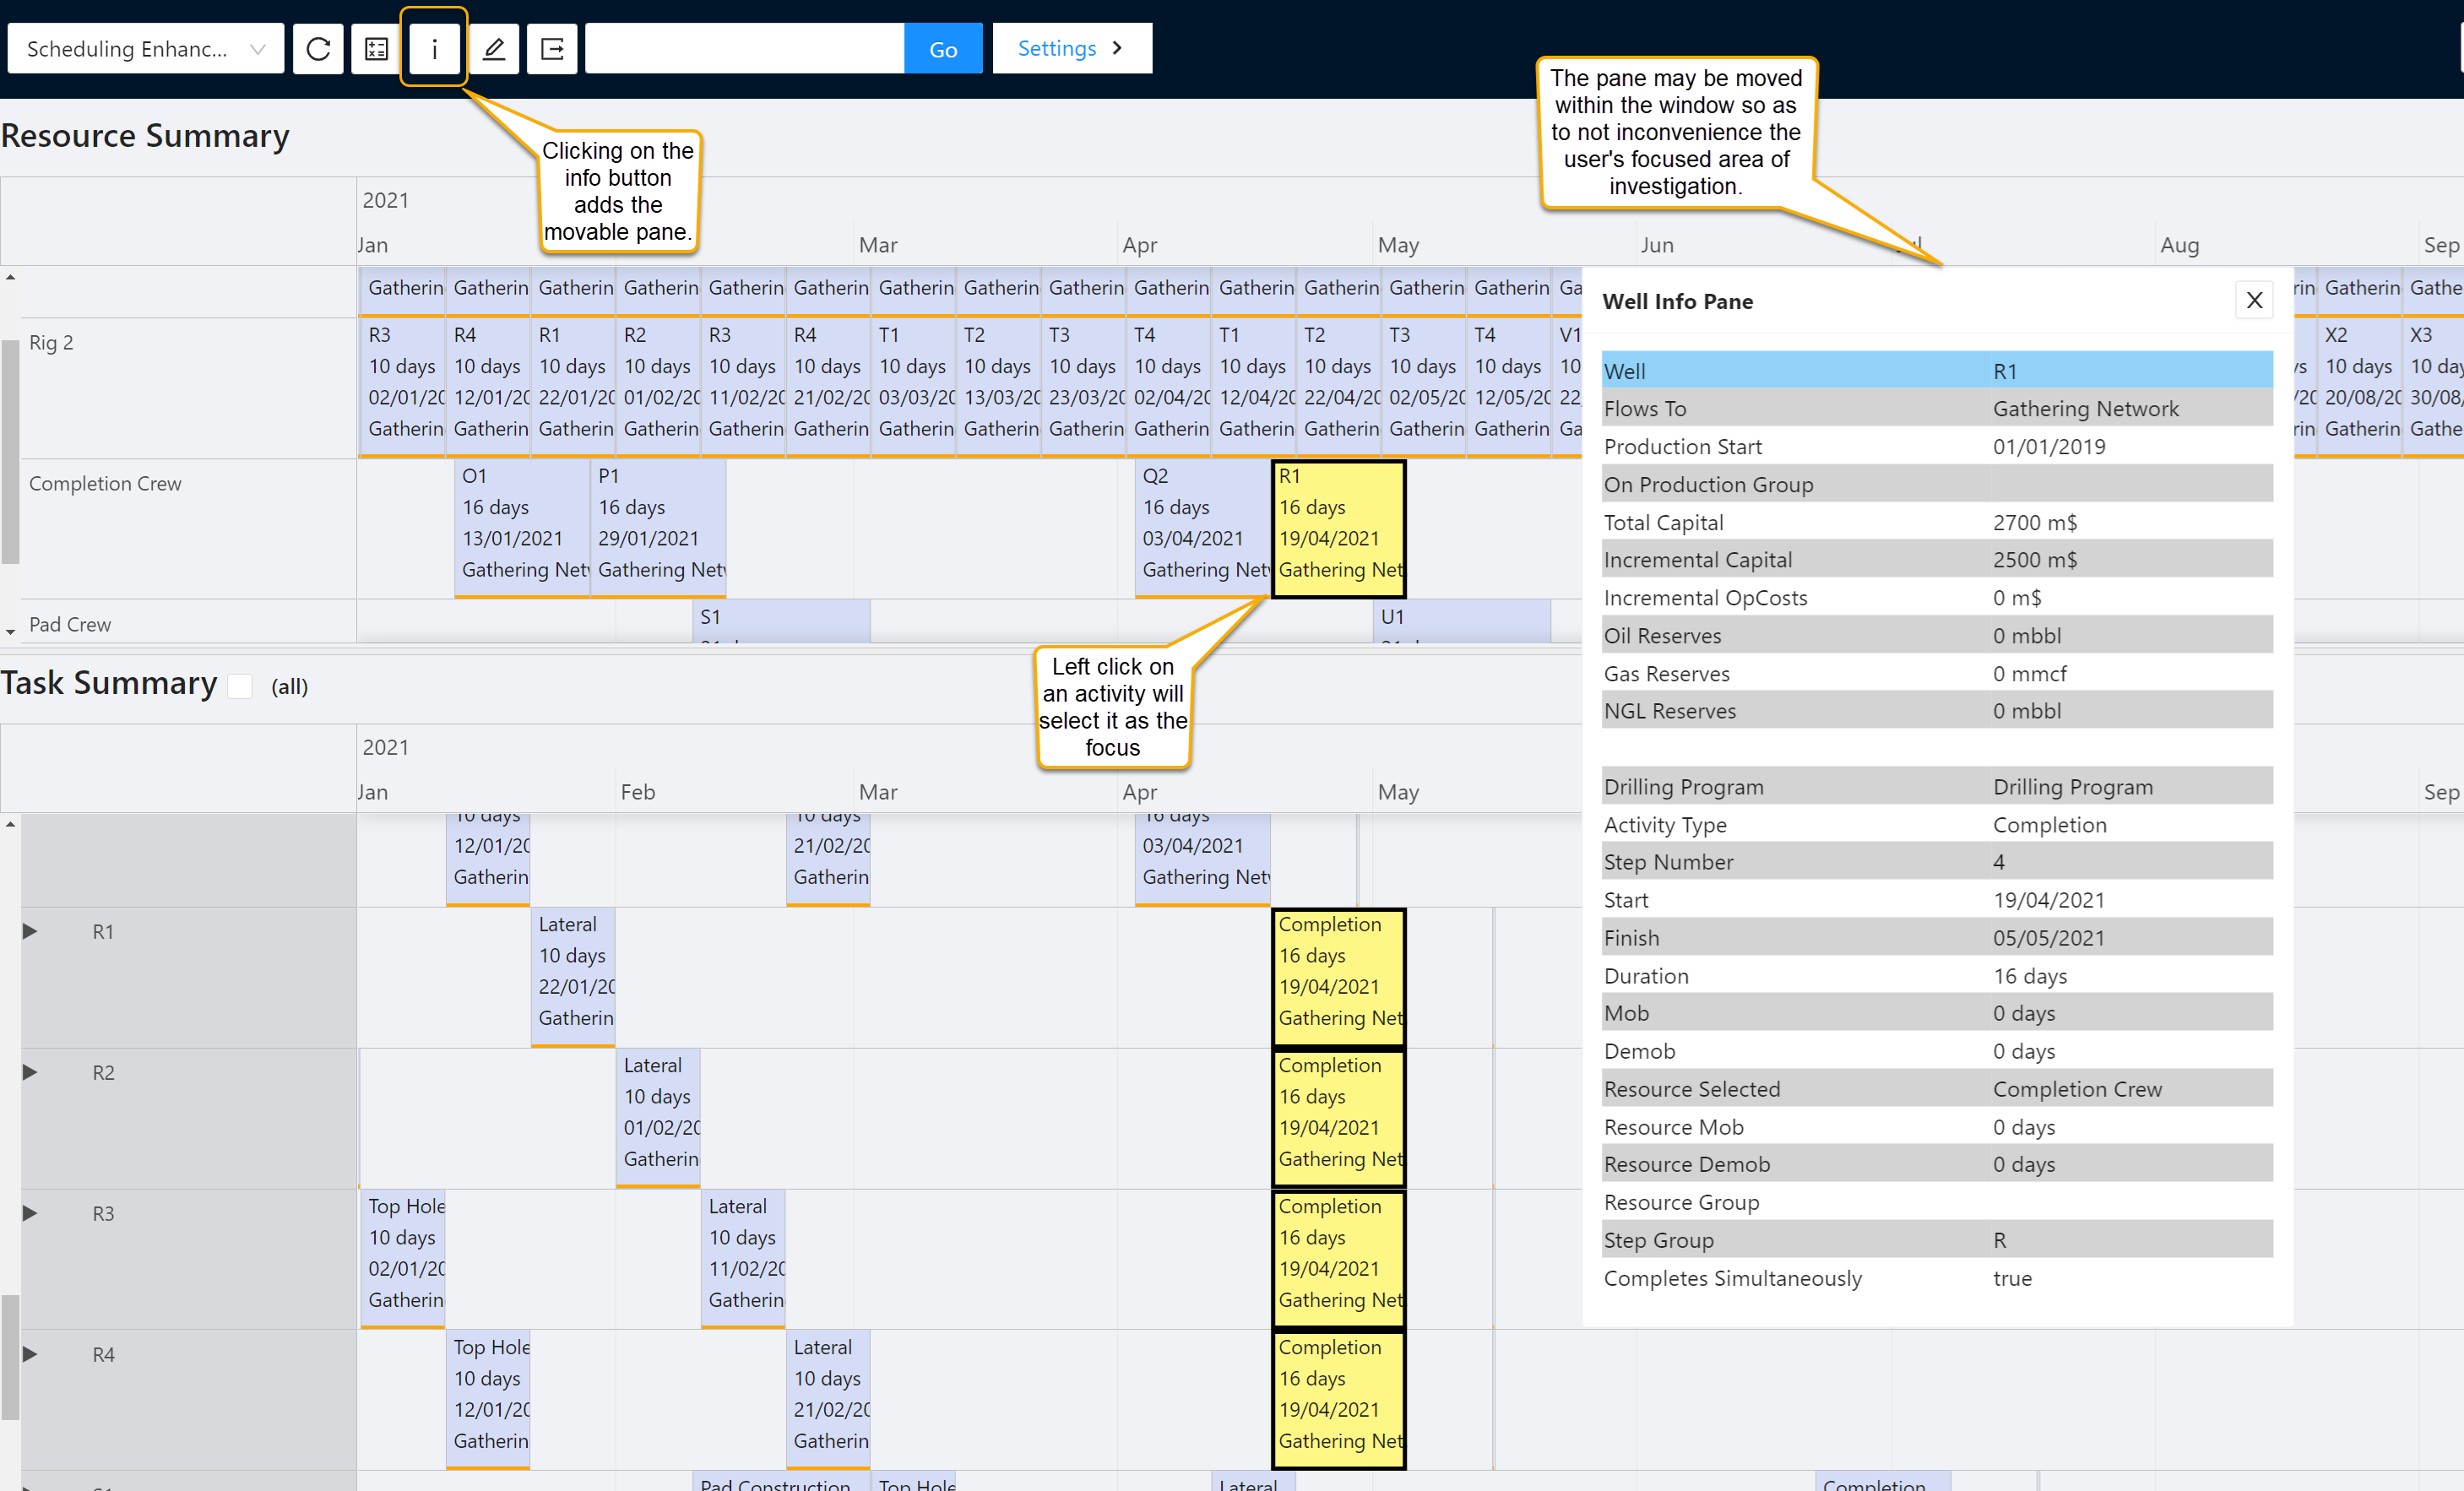
Click image to expand or minimize.
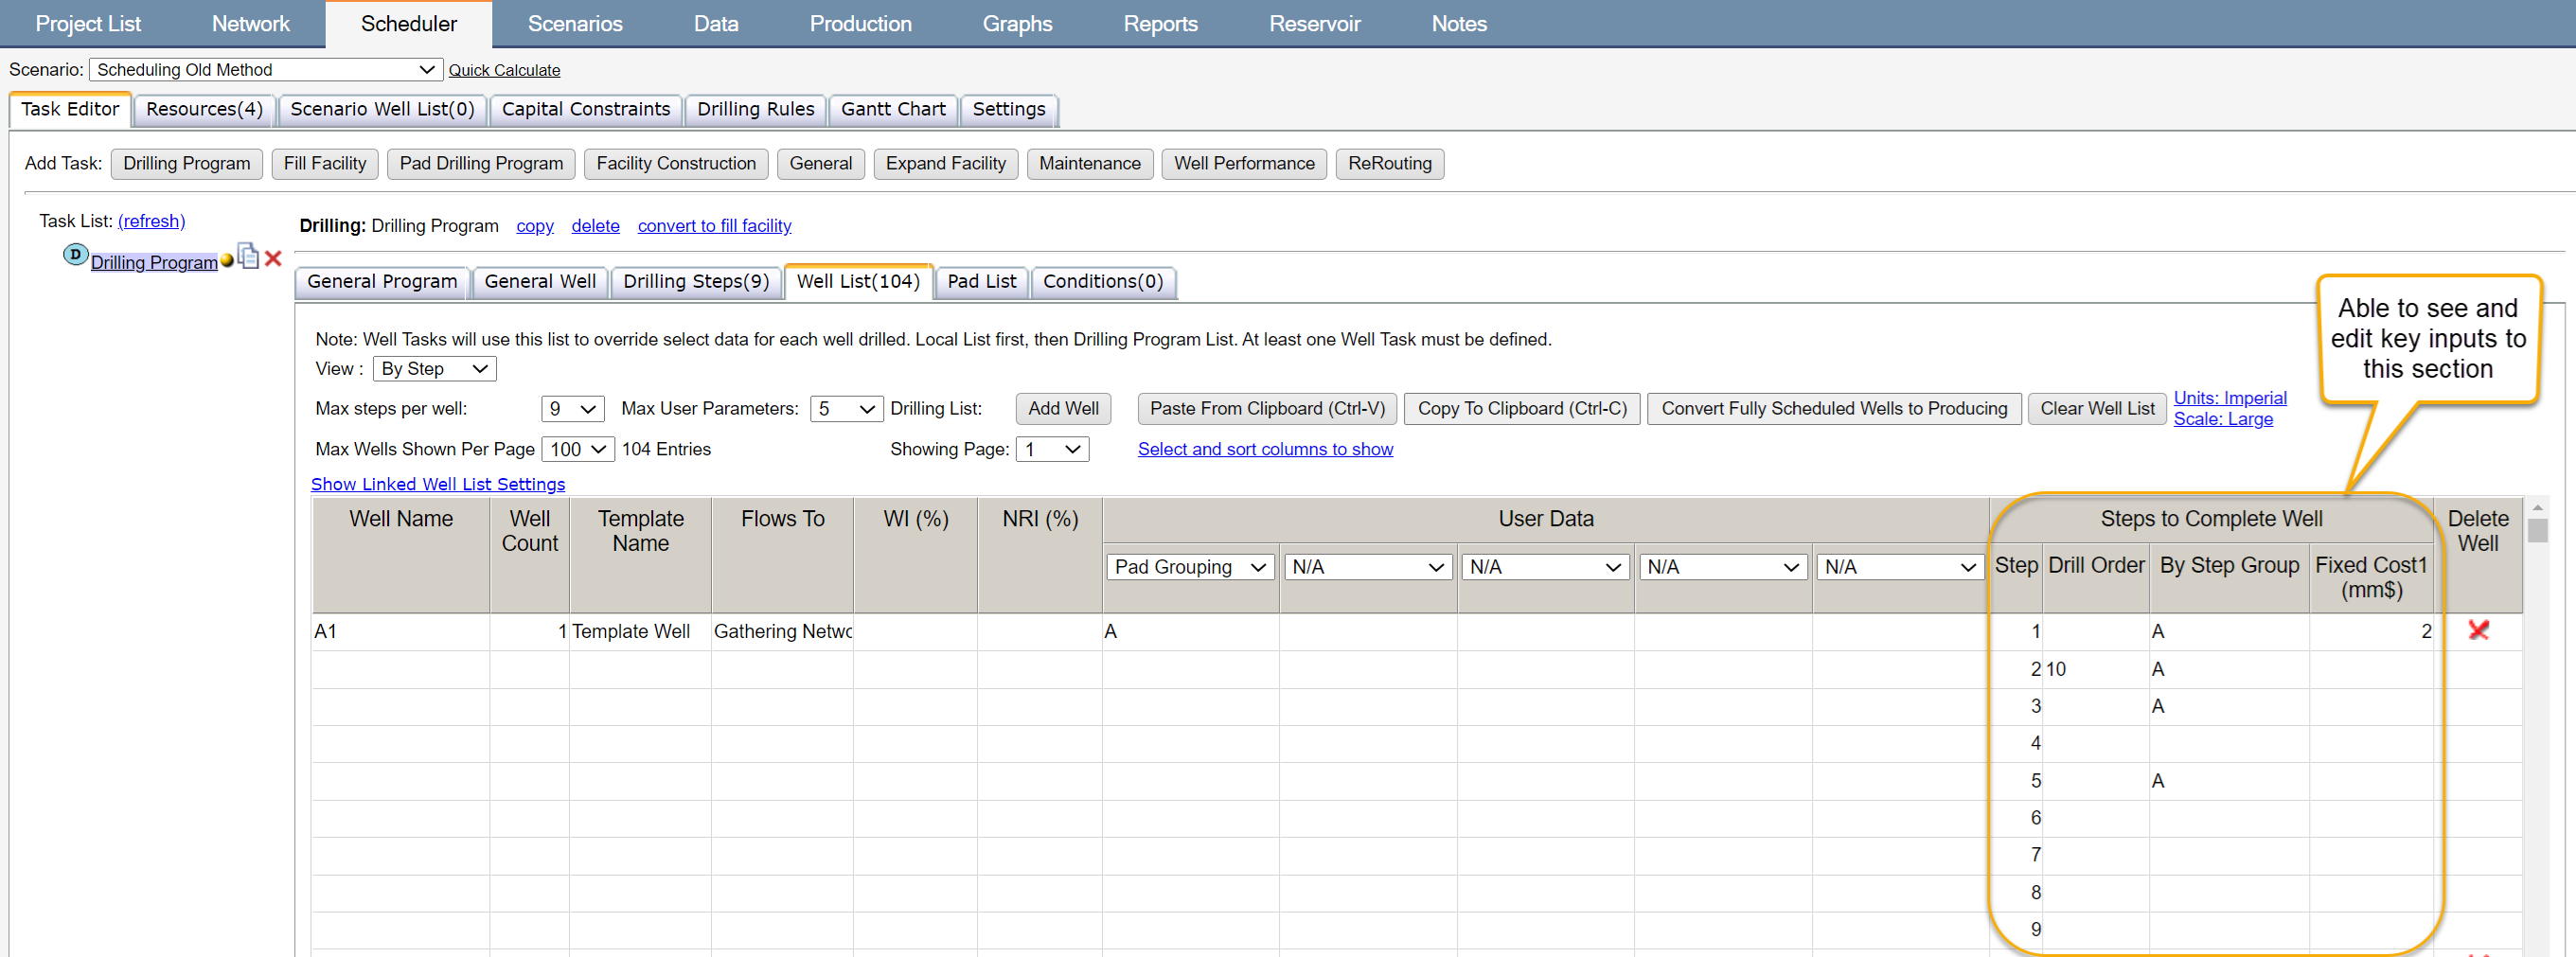
Alternatively, there is also an Edit Pane that allows for the overriding values of the Well List to be edited as required so as to affect subsequent calculations.
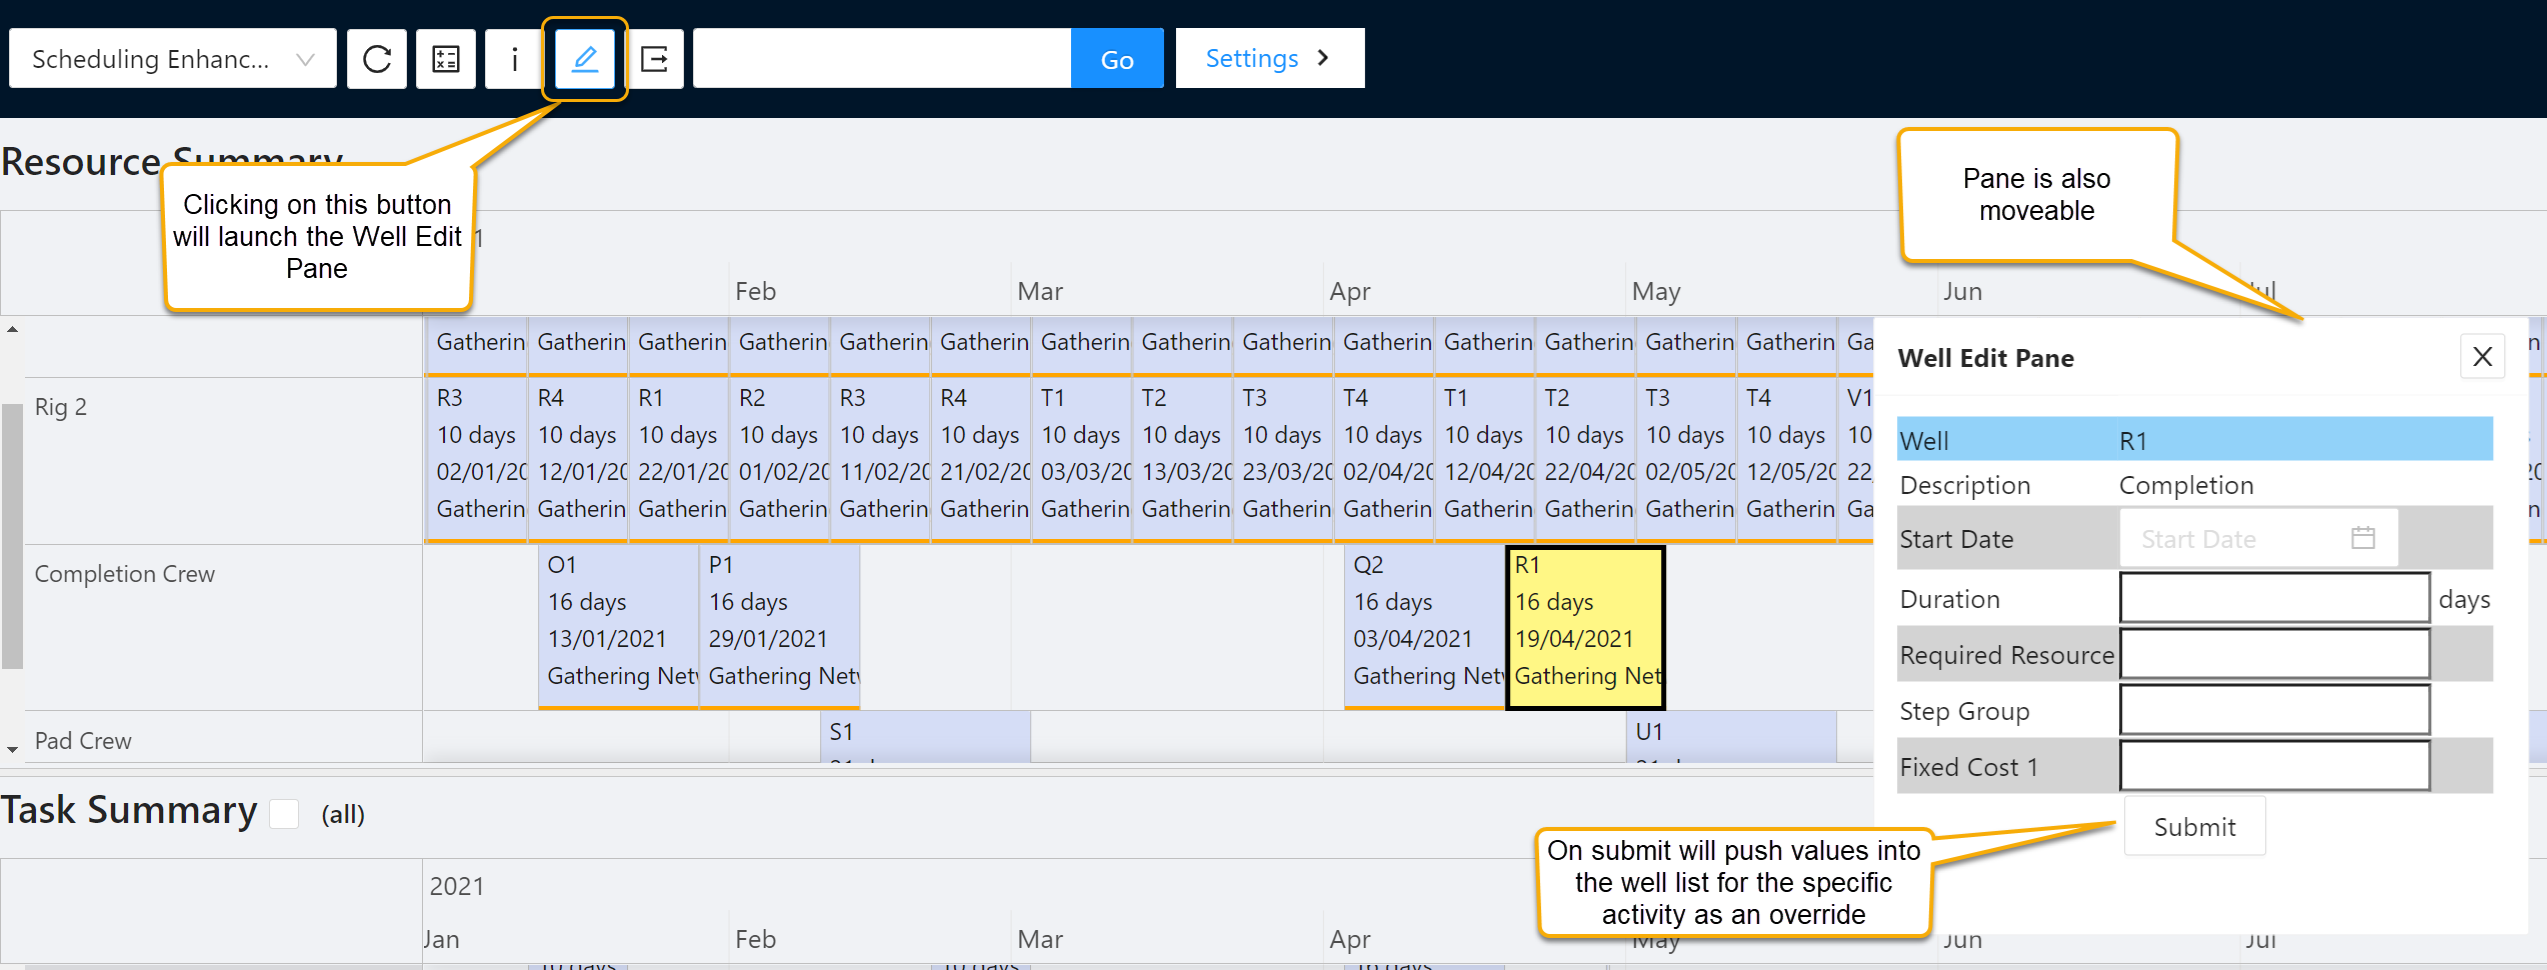
Click image to expand or minimize.
Click image to expand or minimize.
In addition to being able to edit Well Activity Inputs, if you select an Activity RTx Status box and open the Edit Pane, you may also update the status of the activity – with corresponding changes made to the non-inputted field as well as into the well list / on the static activity within the network screen as applicable.
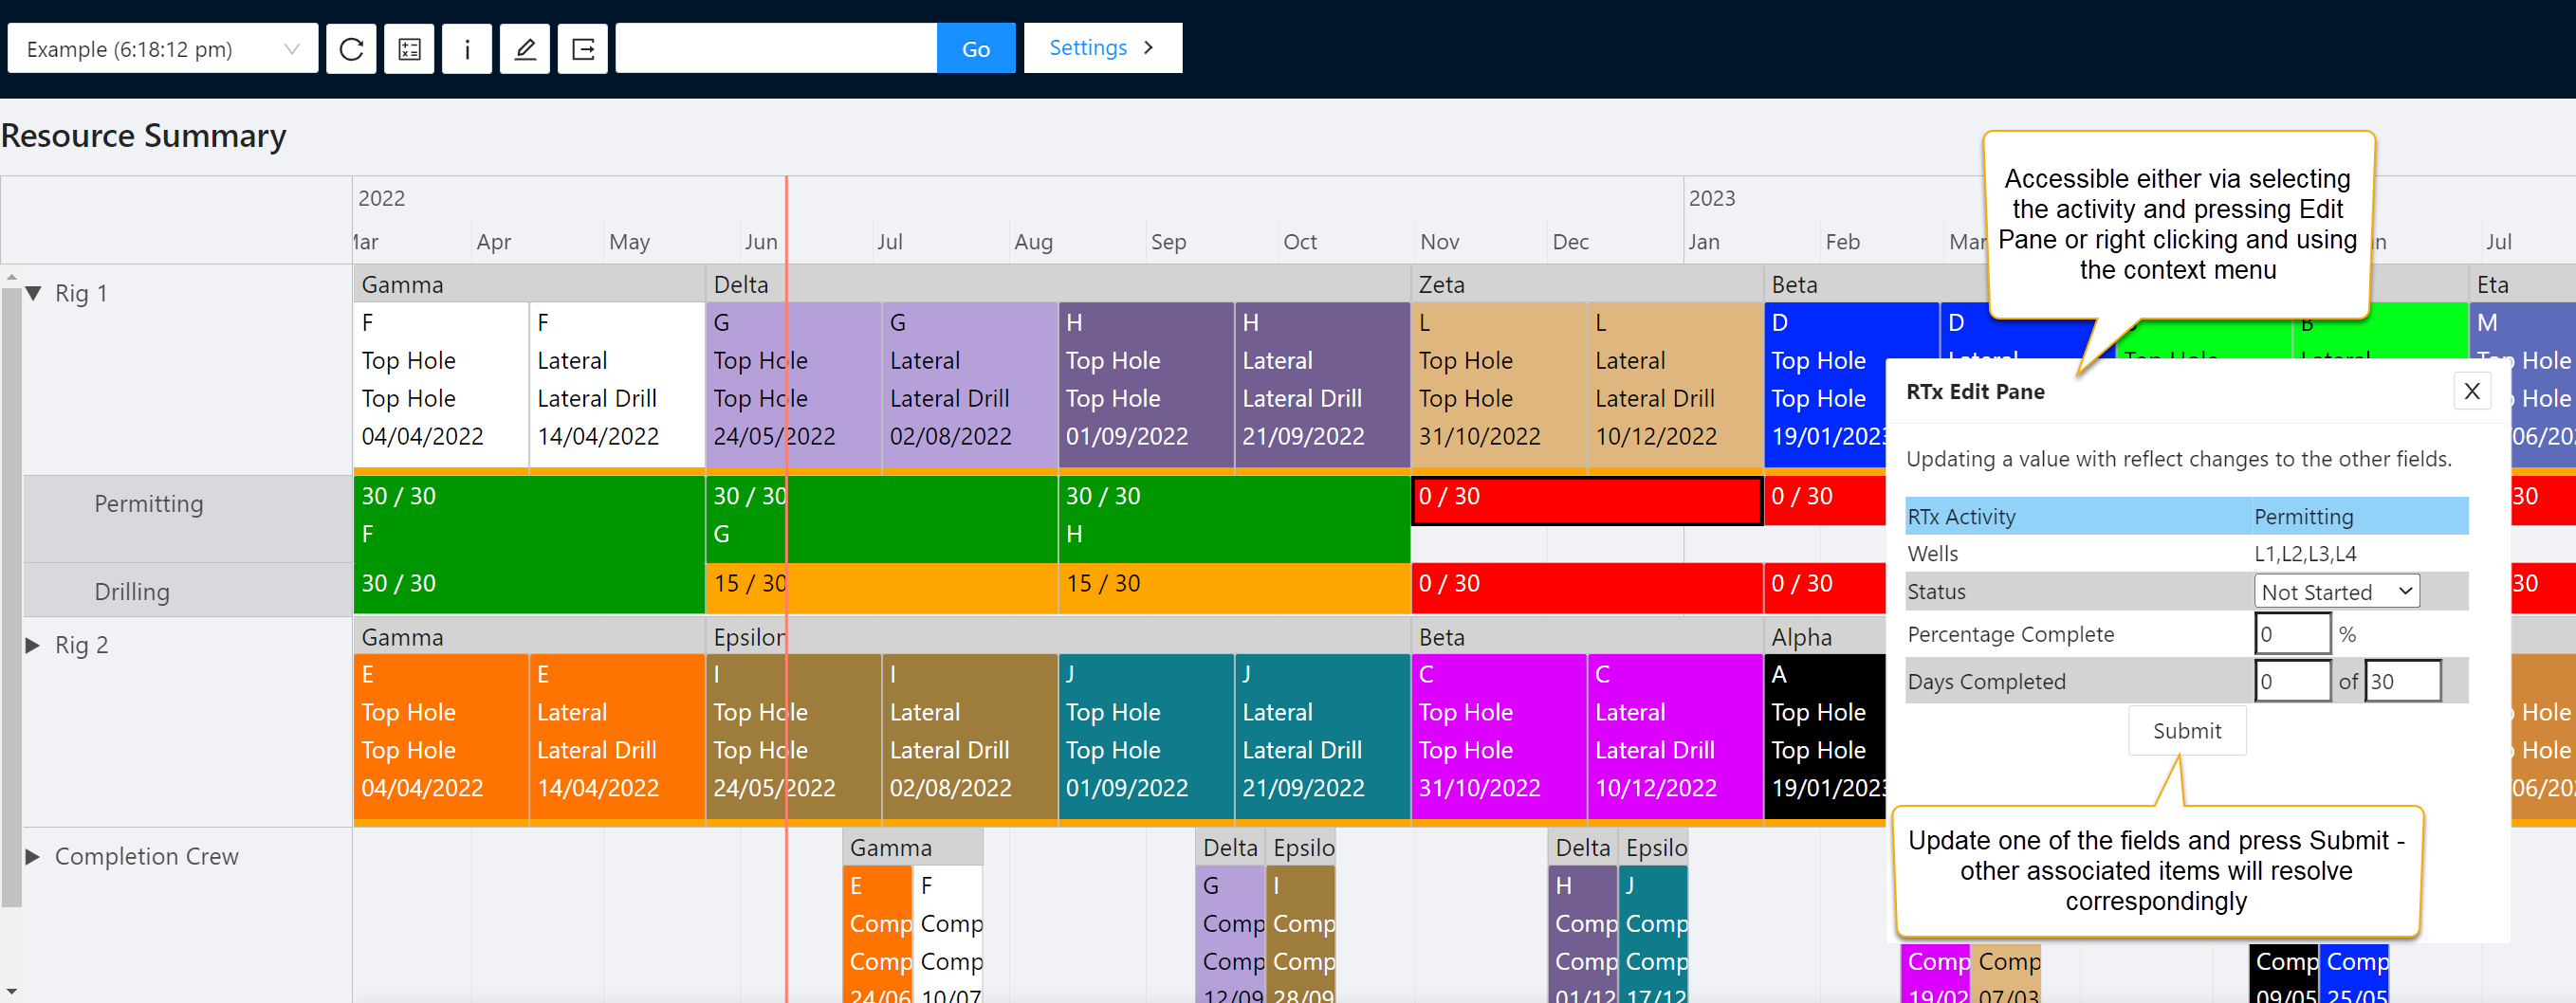
Click image to expand or minimize.