Scheduler display options can be customized by clicking on the Scheduler tab, then the Settings tab, and underneath the Display Settings tab.

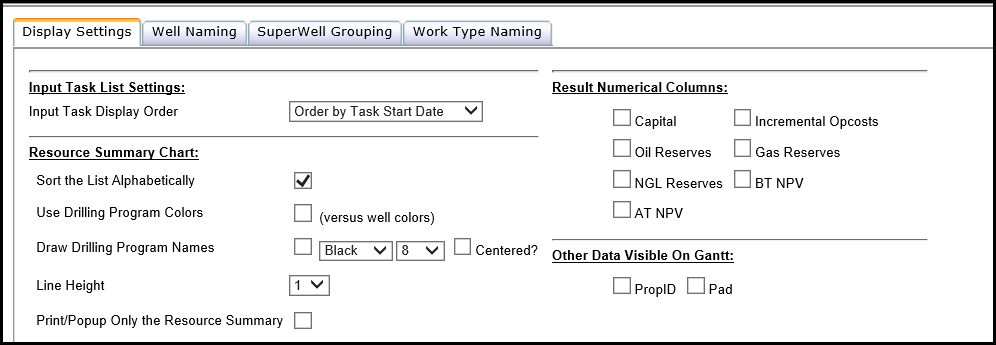
Here we can customize a number of settings that are all useful for graphical displays on the Gantt chart.
Click image to expand or minimize.
- Input Task List Settings – allows the user to order the tasks in the Gantt chart by start date, name, calculation order, or resource

- Resource Summary Chart – allows the user to sort the list of resources alphabetically, use drilling program colors as opposed to well colors, etc.
- Result Numerical Columns – allows the user to specify which results associated with each task in the Gantt they would like to display.
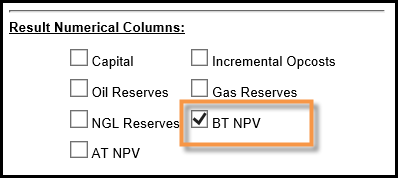

- Other Data Visible on Gantt – allows the user to specify if they would like to make these other data types visible on the Gantt.
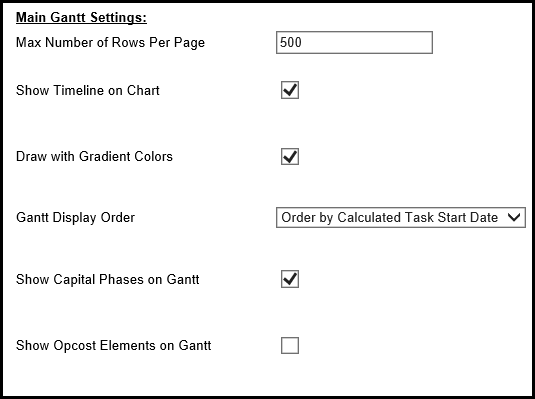
- Main Gantt Settings – allows the user to specify the maximum number of rows to display per page, whether or not to show the timeline on the Gantt, display gradient colors, show capital phases, or opcost elements.
Click image to expand or minimize.
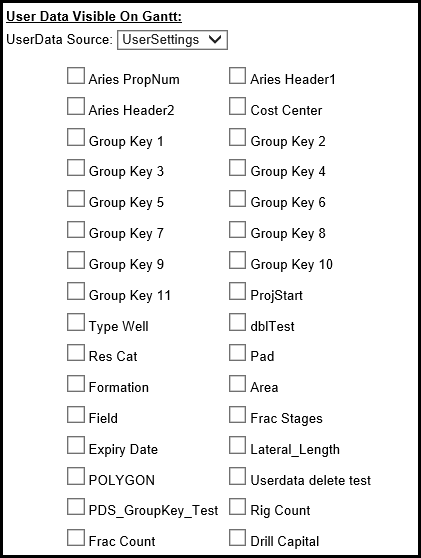
- User Data Visible on Gantt – allows the user to choose which user data tags they would like to display on the Gantt, so each task can be associated with a user data tag if it is available.
Click image to expand or minimize.
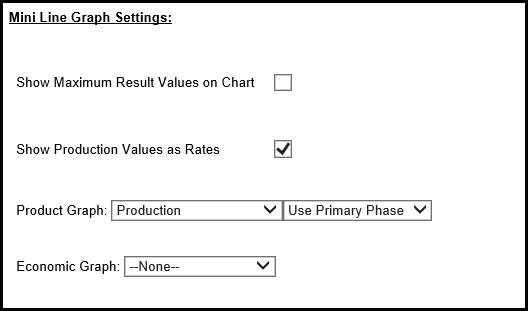
- Mini Line Graph Settings – allows the user to customize the graphical display of the mini graphs on the Gantt. The mini graph is shown in the diagram below in the orange box.
Click image to expand or minimize.

Click image to expand or minimize.
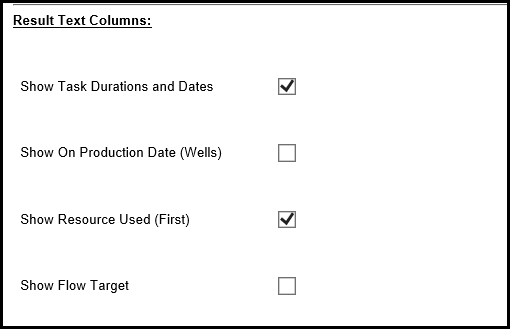
- Result Text Columns – this allows the user to choose what type of text data they would like to display with each task.
Click image to expand or minimize.
