
Gantt JS
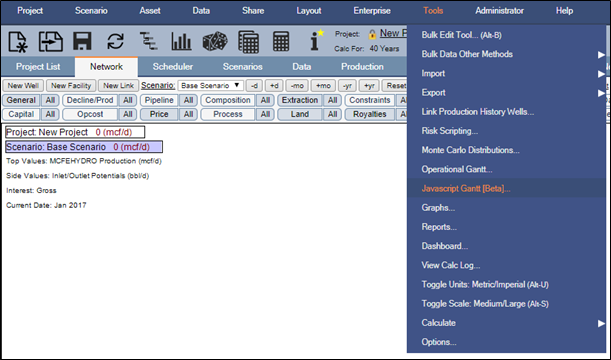
To access GanttJS select Tools \ Javascript Gantt [Beta]:
Click image to expand or minimize.
Outcome Selection
The visualization available is selected via the dropdowns of Scenario and Milestones. Upon recalculation of one or more scenarios within the main Enersight window, the user may press Refresh to trigger a synchronization with the server of the available opportunities. If Clear Cache is pressed, then all historical milestones are removed permanently.

Visualizations
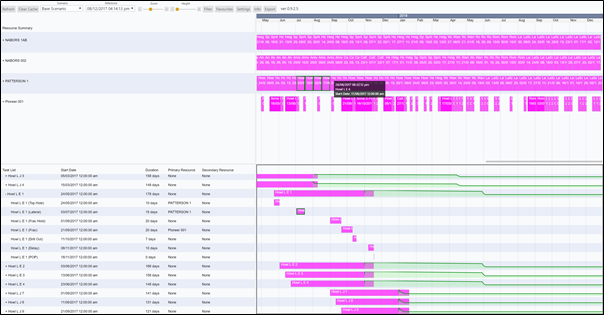
General
The pane currently selected by the user is outlined with a black. This selection guides the interaction within the visualization settings. Left click within another pane to change the selection.
Panes and their descriptions can be adjusted in size via hovering over their boundaries, left clicking and dragging the size. Additionally, panes can be added or subtracted from 0 to 2 via the Settings menu.
Zoom will affect the timescale for the selected vertical group of panes.
Height will affect the vertical size of the boxes within the selected pane only, allowing more or less detail be displayed as appropriate.
Selecting a Resource or Task Activity will automatically scroll to the associated place within the alternative pane.
Tooltip information appears on hover with an initial dynamic query utilized to populate the outcome. Subsequent lookups refer to a local cache of the details.
Pop-up menus may be resized as desired from their bottom right corner.
Multiple Windows
GanttJS allows for multiple windows to be opened of the Gantt Chart, enabling workflows where you may wish to have separate Resource and Task views, wish to apply filters to different views or handle discrete time horizons.
For Chrome and Firefox browsers, a shared data source exists for the Gantt Chart meaning that you may open multiple windows without incurring significant CPU / memory issues on large projects. Each window retains its own link back to the input state and will not synchronize changes made in the other window.
For IE and Edge browsers, each window or tab has its own data manager so has independent in and out instances which may lead to higher memory usage.
Filters
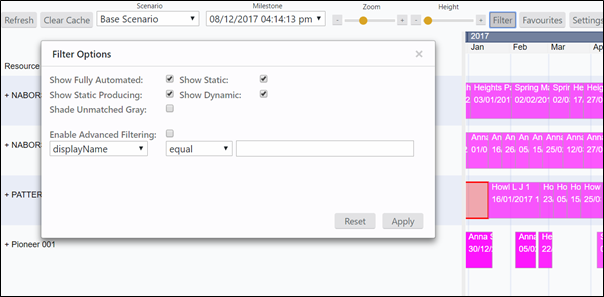
The Filter menu allows for setting whether all types of wells are included within the Gantt Chart or if they are simply grayed out.
Standard selections are available at the top whereby:
- Fully automated references those for which no named resource is allocated, i.e. just those for which there is a generic work type such as ‘drilling rig’ required
- Static Producing are those wells which have been Converted to Producing
- Static are those wells which have been Converted to Static
- Dynamic are those wells which exist only in the Well List
Standard filtering by DisplayName, WellName, TaskName, PrimaryResource and SecondaryResource also exists in conjunction with the above categorizations.
Click image to expand or minimize.
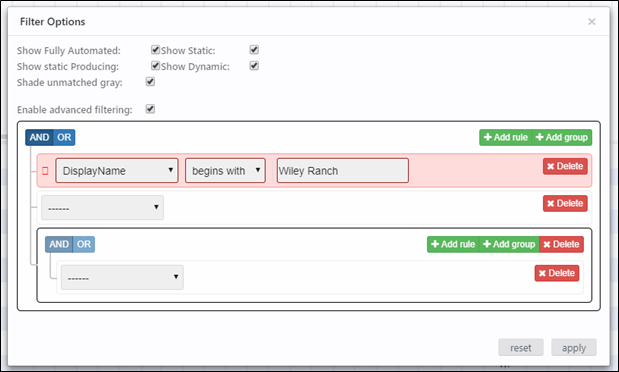
There are also advanced filtering options whereby both rules and groups may be used to determine a complex set of inputs to ensure what is visible / grey is exactly what is desired by the users. This includes the ability to nest different groups within a rule using AND/OR to guide the intersection or union of elements.
Click image to expand or minimize.
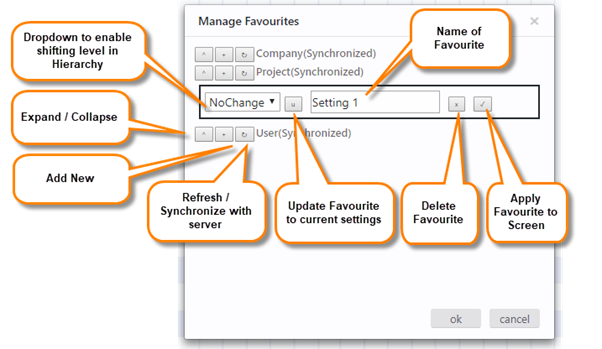
Favourites
Favourites will save the currently applied filters as well the current UI, including the pane size and configuration (resource / task list sizing), the height and zoom. When saving can choose to update and save to the Company, Project or User Level. Saves to Company and User Level are saved automatically and instantly available on Refresh by other instances, however Project level favourites are only committed on project save.
Favourites may be shifted from one level to another from the leftmost dropdown menu
Click image to expand or minimize.
Settings
Click image to expand or minimize.
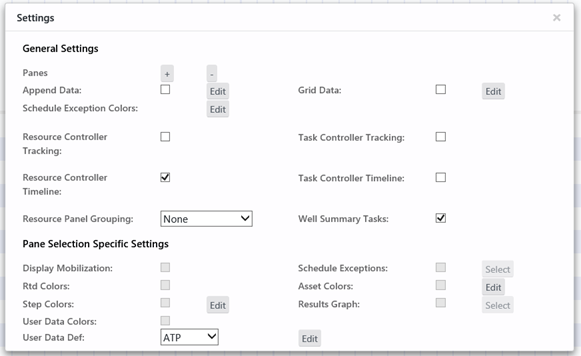
Within the General Settings, you can specify for the entire window the behavior and visualization available. As a part of this, an additional pane may be added which remains synchronized with the initial pane but may have a different zoom level selected, enabling the context of a zoomed in view to be retained. The tooltip and activity boxes may also be updated with the selected appended data whereby general and selected user data can be included, should sufficient height be configured to show it. Grid data may be appended next to the Task list.
Resource Controller Tracking & Task Controller Tracking modes help focus the analysis down to the specific selected resource or task associated with the entity selected, hiding all other elements from within the alternative section. Multi-select is available for controlling these viewing modes.
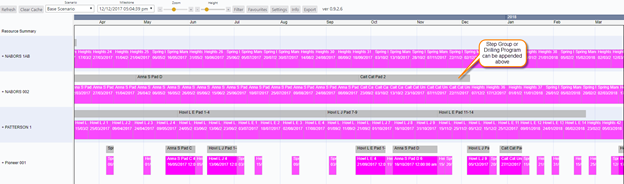
Within the Resource Panel, grouping may be appended above by Drilling Program or Step Group inputs
Within the Task Panel, can specify if the Well Summary Task should be visible to enable gauging the entire drilling program process.
The pane selection specific settings enable visualisations within the currently selected pane. As a part of this colours may defined based upon RTD, Step, Asset or User Data Definition. Additionally the mobilization and schedule exceptions may be seen. Finally there is the ability to append a normalized production stream (oil only initially available) to the task results so as to enable visualization of outcomes.
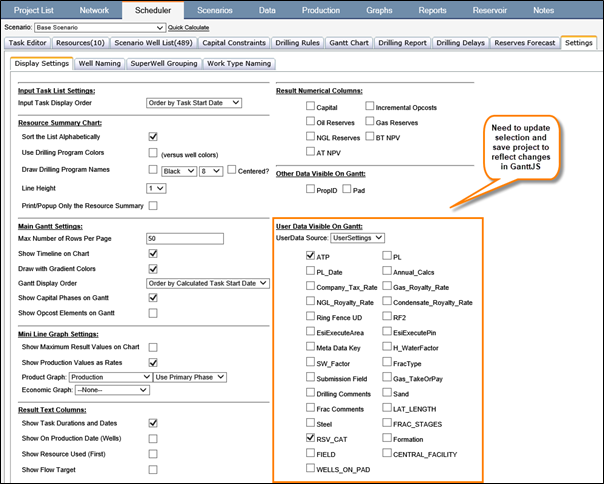
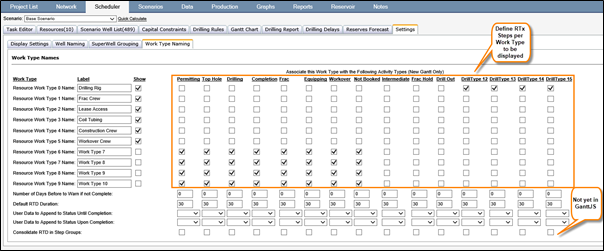
With regards to the User Data Definitions for colouring, can configure the groupings so that specific colours are applied per unique entry of each UD with the definition set then selectable for use within the pane. In order for these elements to be visible within this grouping they must first be selected within Scheduler / Settings / Display Settings, then the project saved:
Click image to expand or minimize.
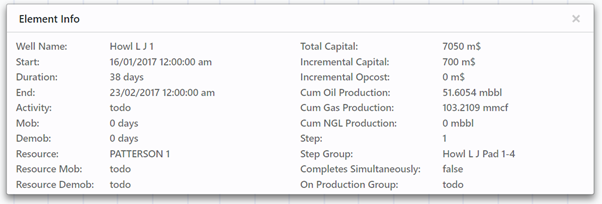
Info
This brings up the Element Info which details a full set of scheduling details for the currently hovered over step or well.
Interactivity
There are two main sections of interactivity that may be accessed within the latest milestone. These interactions can be triggered via right clicking against an activity within the Resource Summary pane.
- Convert to Producing / Convert to Static
- This occurs identically to the GanttSL workflow whereby the well list is updated so as to remove or set the well count to zero as appropriate with schedule, production and capital data fixed in the case of Producing being selected.
- RTD Status tracking and Modification
- Able to update activity status per resource usage.
- Within this can select to update as per:
- Activity Status
- Percent Complete
- Day/Duration
Export
This menu allows the download of either the task or the resource pane to SVG format whereby it can be reopened for interrogation or printing within a browser at full scalable resolution.