
Example of Learning Curves for Drilling Time & Cost
In a resource play, significant learning can be achieved over the development of the field and can noticeably impact drilling time and costs. A learning curve based on well count requires a drilling program to know how many wells have been previously drilled, and the schedule for the drilling program needs to dynamically reflect the learning.
Creating a Learning Curve
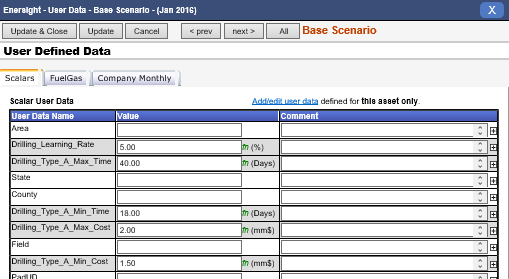
Functions utilized are built upon user defined scalars within the example to enable quick updating of inputs and centralization of data entry across multiple drilling program, however formulas could alternatively be hard coded with costs and/or time requirements:
Click image to expand or minimize.
Click image to expand or minimize.
The algorithm for the learning curve is defined by the user. In this case a simple deduction of 5% each time the drill count for the particular drilling program doubled was utilized.
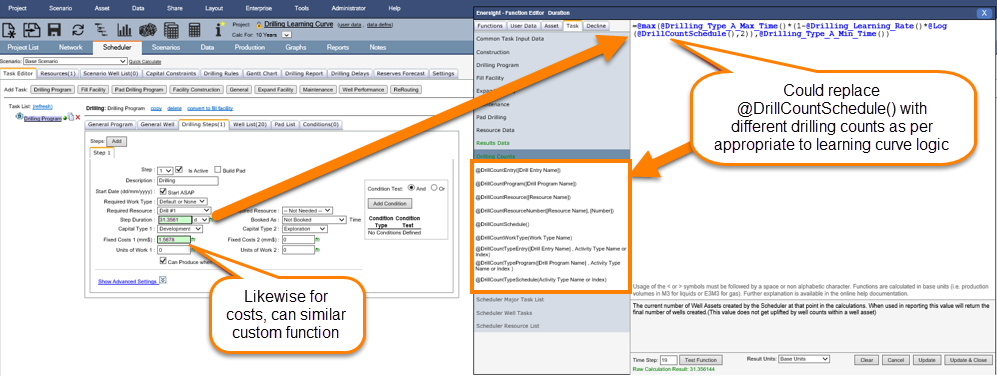
Function as utilized for time based variance:
=@max(@Drilling_Type_A_Max_Time() * (1-@Drilling_Learning_Rate() * @Log(@DrillCountSchedule(), 2)), @Drilling_Type_A_Min_Time())
Function as utilized for cost based variance:
=@max(@Drilling_Type_A_Max_Cost() * (1-@Drilling_Learning_Rate() * @Log(@DrillCountSchedule(), 2)), @Drilling_Type_A_Min_Cost())
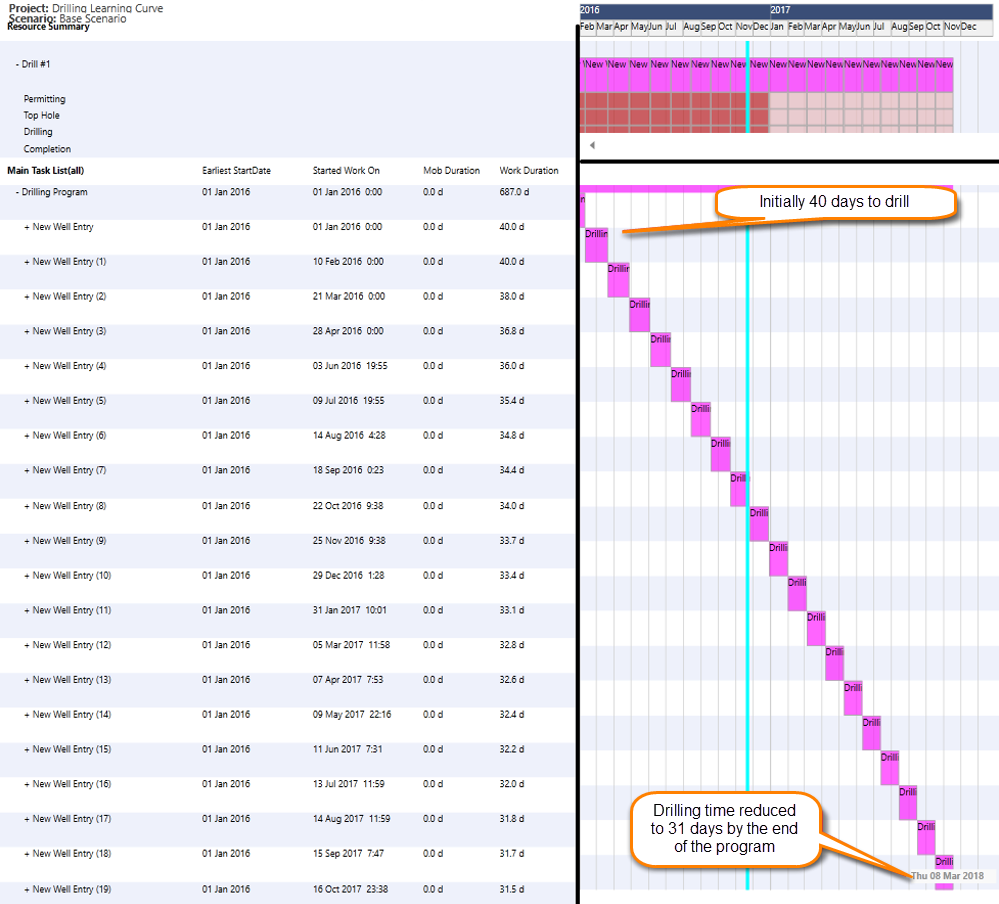
Results of a Learning Curve
The impact of the learning curve can be observed in the drilling times for the wells over the life of the drilling program. In a similar fashion the cost reduce which can be viewed within the reports.
Click image to expand or minimize.