
Enersight User Settings
Enersight has the ability for each user to have their own preferences and default settings. Having these configured properly before starting to use the software will help to simplify the user experience. Settings include the unit system, unit scale, discount rates, and default economic models and prices to use. User Settings are accessed from the System Menu Ribbon under Tools > Options.
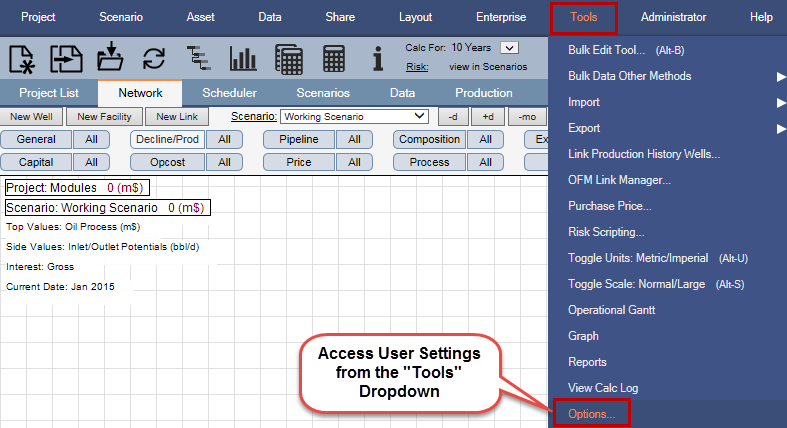
Click image to expand or minimize.
The following user settings are recommended:
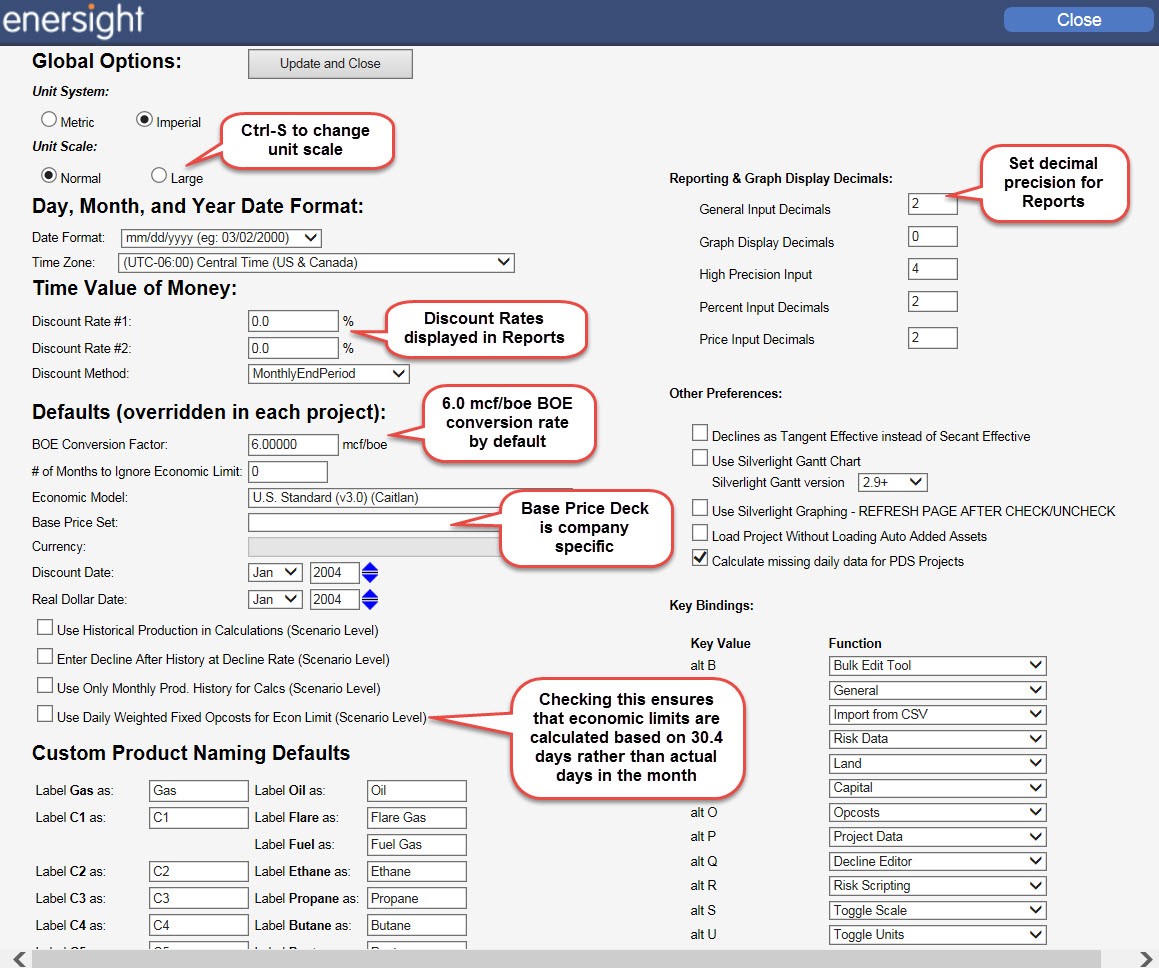
Click image to expand or minimize.
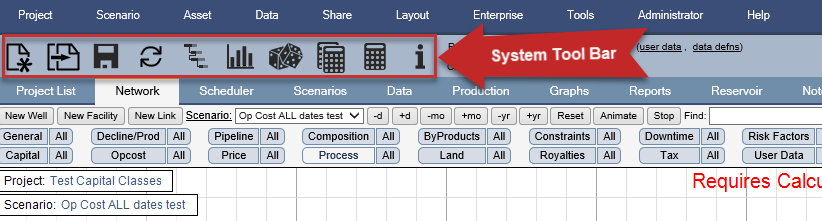
System Menu Ribbon
The Menu ribbon along the top provides access to general functions while the Tool bar provides access to the commonly used functions. Navigation tabs offer an extensive list of commands or links to specific sections of the application.
Project – Create, save, rename, delete a project
Scenario – Manage scenarios within the current project
Asset – Manage assets (wells and facilities) in the current scenario or project
Data – Access the data records for the current asset
Share – Manage data sharing between assets across scenarios
Layout – Modify asset network layout in the Network tab
Enterprise – Allows access to Enterprise-enabled features (requires additional licensing)
Tools – Access specialized software tools and user options
Administrator – Create and modify administrative documents
Help – Access Enersight's online help system
Logout – Log out of your account session
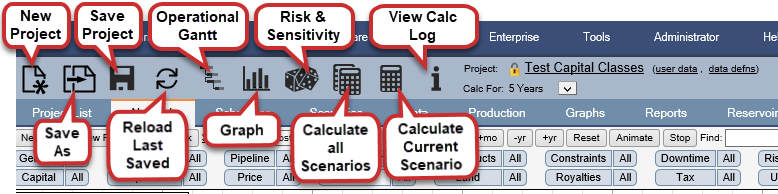
The System Toolbar
System Navigation Tabs
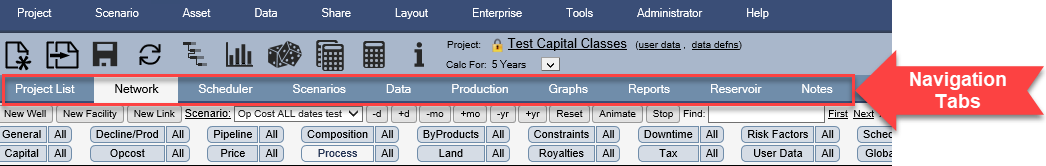
Project List Tab – provides an interface to open and manage your company’s existing projects. The Project Tab also provides access to account administration features.
Network Tab – displays the system’s primary graphical interface used to create the asset networks and provides means to visually work with the project when entering data or viewing results
Scheduler Tab – builds and manages development plans for construction and drilling projects
Scenarios Tab – provides an easy user interface for the management of a project’s scenarios
Data Tab – displays all of the data associated with the selected asset.
Production Tab – displays production history and creates production forecasts with a graphical, volumetric decline curve analysis tool
Graphs Tab – generates charts and graphs of results
Reports Tab – provides detailed reporting of results
Notes Tab – used to record notes on the project
Reservoir Tab – manage reservoir data from which type curves may be generated