
Land
Introduction
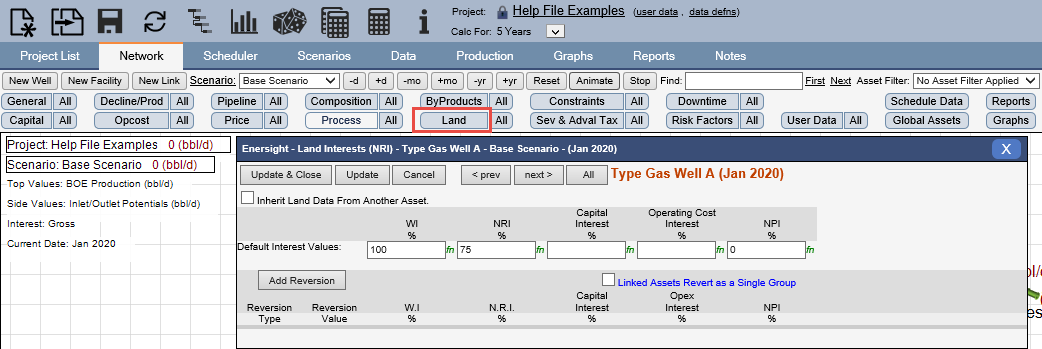
Click image to expand or minimize.
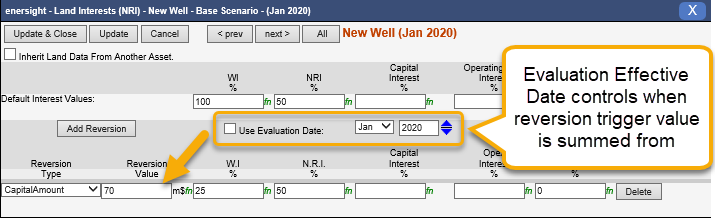
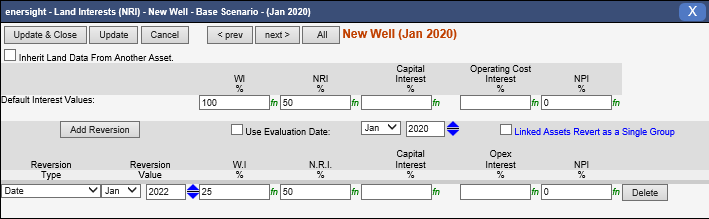
2.14 onwards, the reversion trigger amounts may be evaluated from a specific effective date onwards rather than from the asset start date to assist in aligning with current accounting values without replicating significant history. These settings may be enabled via these settings:
- Reversion Use Evaluation Effective Date
- Reversion Evaluation Effective Date
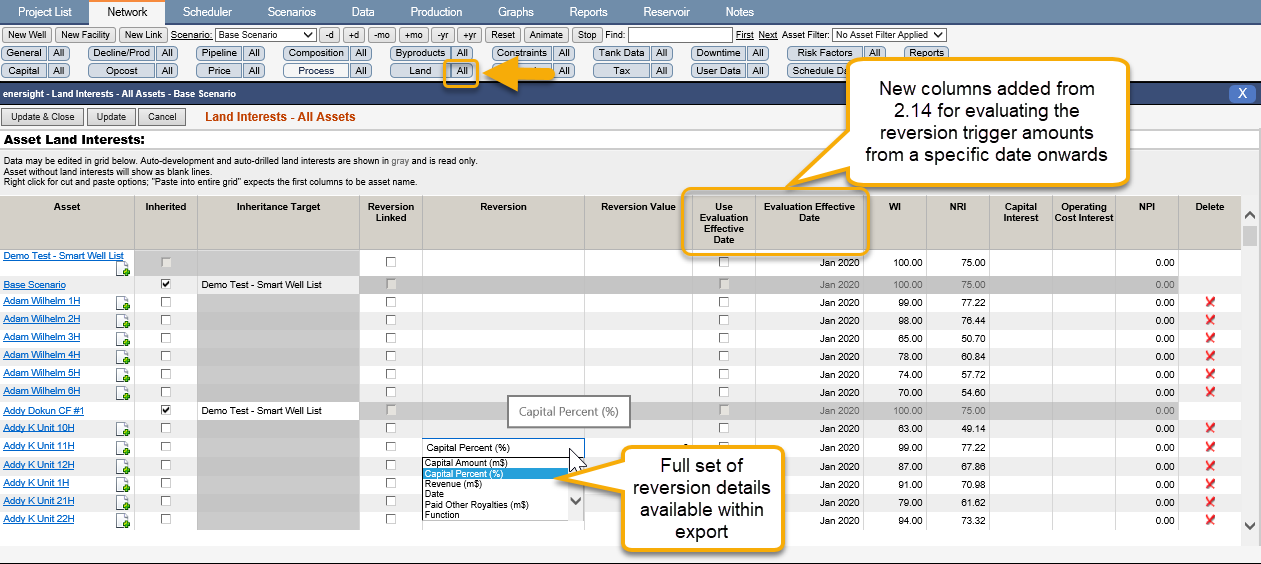
The data may also be viewed in bulk via the All button which allows for direct editing within the grid or for the data to be copied/pasted from mass changes or QA/QC processes.
Click image to expand or minimize.
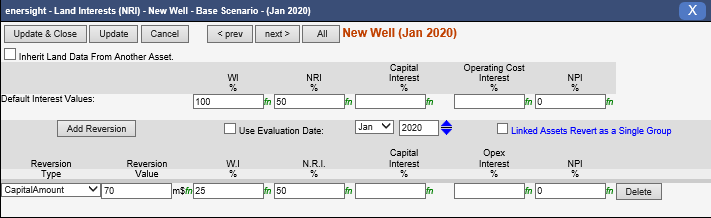
Reversion Type: Capital Amount
Reversion Value: Cumulative Operating Income ($m)
When the well’s cumulative operating income exceeds the capital value entered in the “Reversion Value” text box, the interest values of the well will change from their default values to the values associated with the Reversion.
Click image to expand or minimize.
Validating: Production Rates vs. Cumulative Operating Income
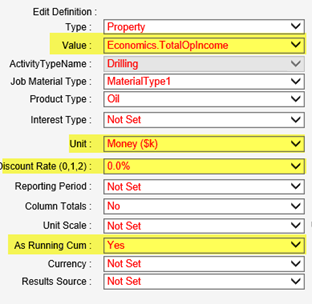
When pulling a WI Report Type, the production rates will switch to the new WI value when the Cumulative Operating Income is greater than the reversion capital amount. A custom report column for the Cumulative Operating Income can be set up as follows:
Click image to expand or minimize.
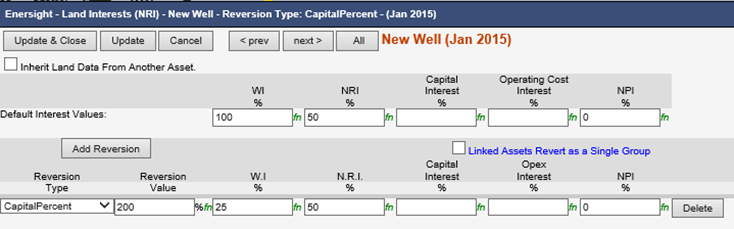
Reversion Type: Capital Percent
Reversion Value: Cumulative Operating Income as a % of Total Capital Spend ($m)
When the well’s cumulative operating income exceeds the percentage value entered in the “Reversion Value” text box multiplied by the total capital spend of the well ($m), the interest values of the well will change from their default values to the values associated with the Reversion.
Click image to expand or minimize.
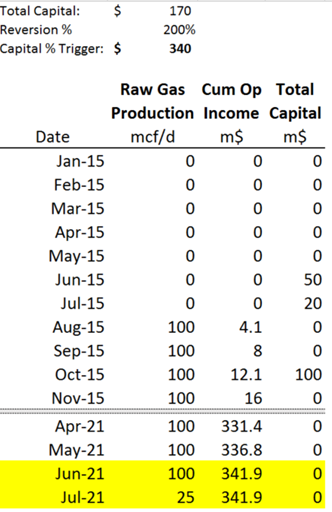
Validating: Cumulative Operating Income vs. Total Capital vs. Production Rates
When pulling a WI Report Type, the production rates will switch to the new WI value when the Cumulative Operating Income is greater than the reversion amount multiplied by the well’s Total Capital Spend. Below is a sample custom report for comparison.
Click image to expand or minimize.
Reversion Type: Function
Reversion Value: Formula that evaluates to TRUE (1) or FALSE (0)
There must be a formula that “asks a question” such that an answer of true or false can be given. At the time the formula evaluates to true, the interest values of the well will change from their default values to the values associated with the Reversion.
Sample formula: =@EconCumDiscount(TotalOpIncome,0)>@EconCumDiscount(TotalCapital,0)

Click image to expand or minimize.
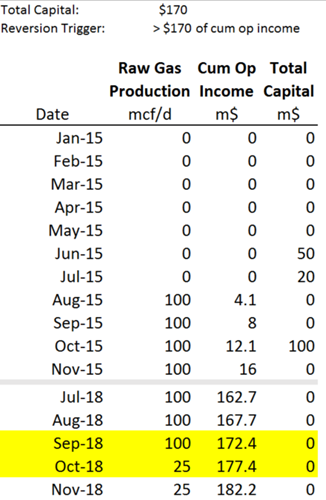
Validating: Production Rates vs. Formula Dependent Data Points
When pulling a WI Report Type, the production rates will switch to the new WI value when the formula evaluates to true. In the example referenced, when the cumulative operating income exceeds the total capital spent (not a % of total capital), the interest values switch. Below is a sample custom report for comparison:
Click image to expand or minimize.
Reversion Type: Date
Reversion Value: Month/Year where interest values should change
At the specified date, the interest value(s) will switch to the value associated with the reversion item.
Click image to expand or minimize.
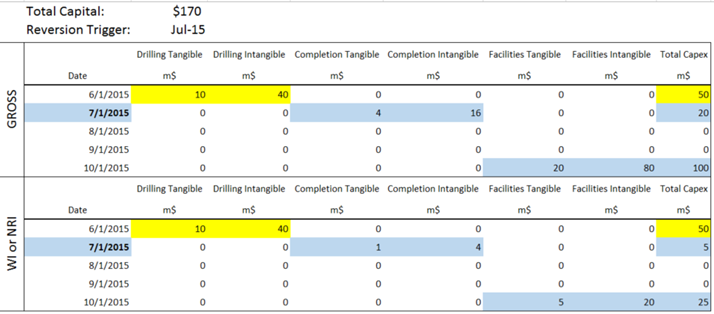
Validating: Total Capital (Gross) vs. Total Capital (WI or NRI)
When pulling a Capital Report, you can pull the report using report types Gross and WI or Net. In the example referenced, the reversion value date occurs prior to the well’s production. Therefore, a production rate report would not help a user validate the functionality. It can be validated by comparing the gross total capital against the WI or NRI total capital. Below is a sample custom report for comparison:
Click image to expand or minimize.
Reversion Type: Revenue
Reversion Value: Cumulative Revenue ($m)
When the cumulative revenue amount exceeds the value entered in the “Reversion Value” text box, the interest values of the well will change from their default values to the values associated with the Reversion.

Click image to expand or minimize.
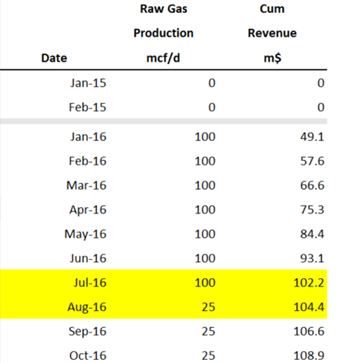
Validating: Production Rates vs. Cum Revenue
When pulling a WI Report Type, the production rates will switch to the new WI value when the Cumulative Revenue is greater than the reversion amount. A custom report column for the Cumulative Operating Income can be set up as follows:

Click image to expand or minimize.
Below is a sample custom report for comparison:
Click image to expand or minimize.
Reversion Type: Production (Oil or Gas)
Reversion Value: Cumulative Production Volume (mbbl or mmcf)
When the cumulative production volume exceeds the value entered in the “Reversion Value” text box, the interest values of the well will change from their default values to the values associated with the Reversion.

Click image to expand or minimize.
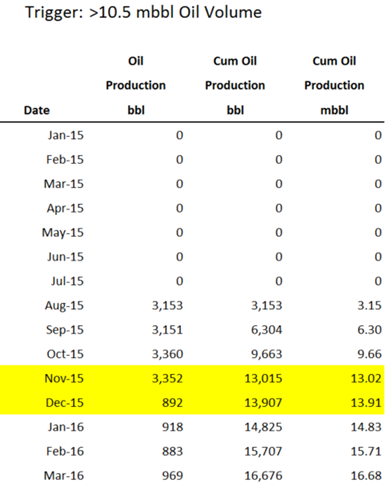
Validating: Production Volumes vs. Cum Production Volumes
When pulling a WI Report Type, the production volumes will switch to the new WI value when the Cumulative Production Volume is greater than the reversion amount. Below is a sample custom report for comparison: (note that the input value is in “mbbl” or mmcf”)
Click image to expand or minimize.
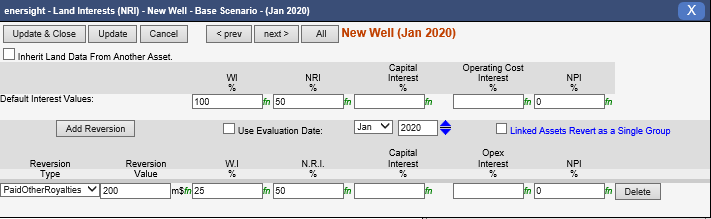
Reversion Type: PaidOtherRoyalties
Reversion Value: Cumulative overriding royalties paid
When the cumulative overriding royalties (amount associated with the NPI% entered) exceeds the value entered in the “Reversion Value” text box, the interest values of the well will change from their default values to the values associated with the Reversion.
Click image to expand or minimize.
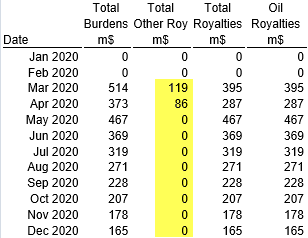
Validating
The Royalty Detail report below shows that May 2020 is the first month where the cumulative other royalty (overriding royalty) is over $200,000:
Click image to expand or minimize.
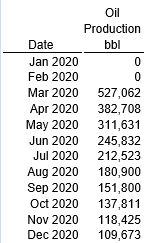
The corresponding gross and net productions (from the Production Volume report) shows that the NRI percentage drops from 75% to 25% between April and May, which matches the values reported in the Working Interest report:
| Gross | Net | WI and NRI |
 |  | 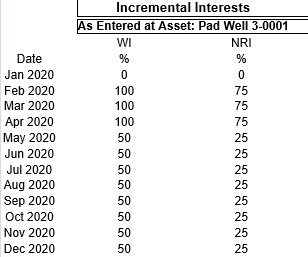 |