
Efficient Frontier
The Efficient Frontier tool helps you decide the optimal combination of projects for the level of risk you are willing to assume.
PetroVR allows you to create efficient frontiers not only for NPV, which is the typical result analyzed with portfolio optimization techniques, but with any Portfolio result such as IRR and maximum cash exposure. This makes it possible to look at the performance of a specific portfolio from different perspectives.
The EF tool performs the analysis of each portfolio combination by recalculating all projects in each Monte Carlo iteration. By applying the method described by Jason McVean (McVean![]() McVean, Jason. “An Alternative Approach to Efficient Frontier”, available at the Schlumberger-SIS website: http://www.slb.com/content/services/software/valuerisk/expert_paper_monte_carlo.asp) the correlation between projects will implicitly be contained in the analysis results and the Efficient Frontier calculations will automatically be correct.
McVean, Jason. “An Alternative Approach to Efficient Frontier”, available at the Schlumberger-SIS website: http://www.slb.com/content/services/software/valuerisk/expert_paper_monte_carlo.asp) the correlation between projects will implicitly be contained in the analysis results and the Efficient Frontier calculations will automatically be correct.
When you press the  Calculate EF button, PetroVR runs a Monte Carlo on Portfolio, and uses the set of probabilistic results thus generated to build EF iterations. EF iterations are calculated by varying the working and net interest of each project according to the probability distribution defined for these variables in it. If no distribution has been defined for a project, is included or excluded at random (i.e., a 100% or 0% value is assigned to its working or net interest).
If not probability distributions have been defined for any of the projects included in the EF calculation, and the number of iterations is equal to or higher than the number of possible combinations, PetroVR runs only the necessary number of iterations for covering the possible combinations.
Correlations defined at the Portfolio level are not taken into account when calculating Efficient Frontier.
Click image to expand or minimize.
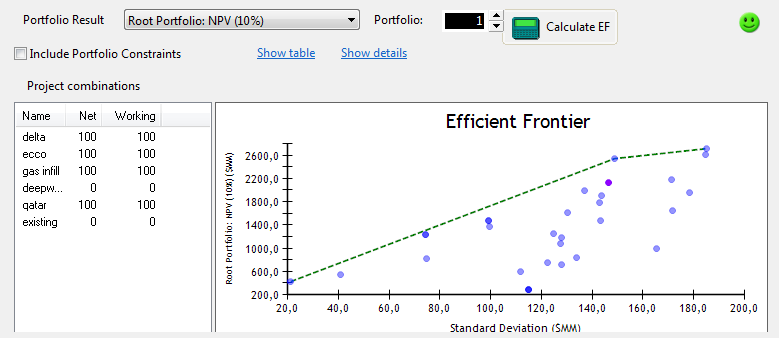
The Efficient Frontier window comprises two areas: at the top, you have options for selecting the visualization mode, and at the bottom the graphs and tables where results are displayed.
- Portfolio Result: Select the result from portfolio to be plotted. Only single-type results can be selected here.
- Portfolio: Select an EF iteration, which represents a complete set of probabilistic results obtained from running a MC on the whole portfolio. You can also select iterations from the graph below - the selected iteration (identified by number) will be marked with a different color.
- Include Portfolio Constraints: Show only those iterations that met the constraints defined at the root portfolio level.
- Show table / plot: Choose between displaying the details of each iteration in a table or as a graph with a list of project combinations.
- The plot shows all iterations, with the value assumed by the variable on the y-axis and the standard deviation on the x-axis. Darker points indicate a higher number of iterations; click on a point to view the iteration details. The Efficient Frontier, indicating the evolution of optimal combinations for each level of risk, is represented by a green dashed line linking the highest points in the graph. The Project combinations list on the left shows the net and working interest on each project for the selected iteration; click on a project to highlight those iterations where that project was included.
- The table option shows a list of all iterations with the value assumed by the selected result in each, its standard deviation, and the projects included. Select Included for iterations that met the root portfolio-level constraints, Excluded for those who did not meet the constraints, and Efficient Frontier for the optimal combinations.
- Show/ Hide details: Show the bottom pane with all results (singles and arrays) in graphs and tables, and the notifications and constraints defined at the root portfolio level.
- The graph in the Results sub-tab displays all results of the main portfolio (single and array types) for the selected iteration, as well as the notifications triggered. Below, the notifications and constraints defined at the root portfolio level are listed.
- The Statistics sub-tab shows a list of all single-type results with its statistical indicators, and a graph for array-type results.