
Spider
The Spider feature allows you to study how value changes in a specific input variable affect one or more single results; these results are displayed both in tabular form an in Spider (aka Radar) plots. It can be accessed by selecting the  button in the Toolbar in the PetroVR Plan, PetroVR Econ or Contracts windows.
 Add a new value for the variable.
 Enter a percentage to calculate two new values (current value ± percentage).
 Delete the selected value.
 Select the input variable you want to vary.
 Simulate the model for all the values in the list.
 in the upper right corner indicates that the spider simulation has not been run since the last time the model was modified, so that the displayed results (if any) are out of date.
  indicates that the spider simulation has been run with the current version of the model, and the results are up to date.
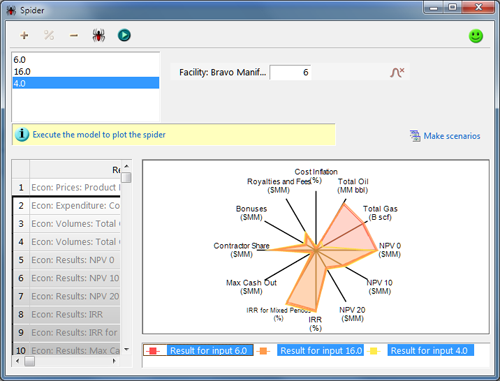
When the model is calculated, a table is displayed with all single results from the economic model for all the specified values of the input variables. A spider plot of all the results appears on the right; select one or several results to obtain separate graphs for each subset.
In the spider plot the normalized results are displayed. The normalization is done for each group of variables sharing the same unit type (MM $, %, MM bbl, MM scf, etc.) For each group of variables the distance from the center to the first spoke corresponds to the minimum result value in that group and the distance from the center to the last spoke corresponds to the maximum result value in that group.
Right-click options for copying from the table of results are available (see Tables); the plot itself can also be copied as an image file.
 Make scenarios: Use this option to create scenarios from spider iterations. A new Scenarios tool window will open with a separate scenario for each iteration.
When only one result is selected, an XY chart is used instead of a the Spider graph, in order to show the impact of the input variable on the selected result more clearly.