
Sensitivity on Variable Values
The Sensitivity on Variable Values tool can be accessed using the  Sensitivity button in the Toolbar, either from a PetroVR Plan project or from a scenario created with the Scenarios tool. It allows you to study how percentage changes in costs, reserves and initial rates as well as in Plan and Econ input variable values impact single results. This sensitivity can be displayed either as a Tornado diagram or as a plot graph.
To run a sensitivity analysis on variable values do the following:
- Use the table to select one or more input variables to be included in the analysis. You can use the
 Add Group button to include all variables of a given type existent in the project as a single input (e.g. All CapEx refers to all variables in Jobs, Wells and Facilities that are CapEx); or use the
  Add Variable button to select individual variables.
 - Use the
 Remove button to remove either type of factor - note that the whole row must be selected for the button to activate. The list of variables will only include variables that have been defined as User Input, i.e. not Excel Input or Function (see Input Modes). Likewise, when a group is added, those variables in that group that have been defined as Excel Input or Function will be excluded from the sensitivity analysis. Grouped variables work as a single entity in the analysis: they are perturbed by the same percentage and only one simulation is run for each group.
Although the only variables that will be modified for sensitivity analysis are those defined as User Input, i.e. not as Excel Input or Function, Functions however may refer to other variables defined as User Inputs, and so will be indirectly perturbed when those other inputs are modified. For example, if you have:
Facility A: CapEx = 10 $MM
Facility B: CapEx = "Facility A: CapEx" / 2
"Facility B: CapEx" is defined as a function so it will be excluded from the list of sensitivity factors; but since it contains a reference to "Facility A: CapEx" its actual value will reflect the change made to the latter. Suppose we modify the value of "Facility A: CapEx" +/- 20%; this will result in:
for Facility A: CapEx = 10 $MM we get Facility B: CapEx = 5 $MM
for Facility A: CapEx = 12 $MM we get Facility B: CapEx = 6 $MM
for Facility A: CapEx = 8 $MM we get Facility B: CapEx = 4 $MM
and so on.
It is possible to run sensitivity only on numeric and date (not Boolean) variables; see further in Variables.
- Only the last three columns in the table are editable from this pane:
- Min %: Minimum value that the variable will assume as a percentage of the original value.
- Max %: Maximum value that the variable will assume as a percentage of the original value.
- Step %: Distance between samples as a percentage of the original value. This means that for example with a Min % of -40%, a Max % of 60% and a Step % of 10% a variable will be perturbed ten times, by -40%, -30%, -20% etc. up to +60%.
- Click the
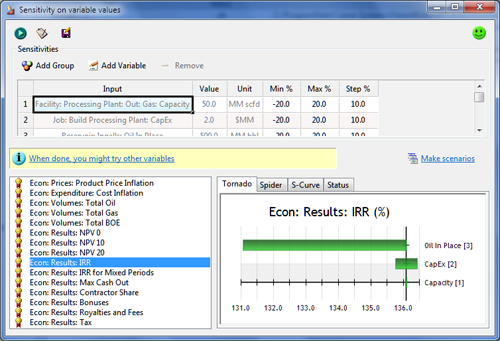
 button. This will run one base case without perturbing any variable, and as many cases for each input variable as required to cover all the steps. In the example of the image above, the total number of cases run is forty-one (1 base case + 4 variables/groups used * 10 percentages each). Thus, each sensitivity factor perturbation is calculated independently.
 - Select any of the results in the list below to graph its sensitivity to changes made to the selected factor. This can be viewed in two forms:
- Tornado: Each bar in this graph represents the value span of the selected result as a consequence of modifying each input sensitivity factor. Variables whose perturbation had the greatest impact are presented further up in the list. The graph is centered on the base case value, marked by a black vertical line. Selecting a bar in the graph will highlight the corresponding row in the table above, and vice versa.
- Spider: This graph presents the value assumed by the selected result for each factor in each simulation run. You can activate/deactivate variables by clicking on the names below. The result values are displayed on the Y-axis, and the input variable/group is represented on the X-axis; right-clicking on the graph offers the option to show either variable values or percentages. When showing values, only one variable/group can be selected. The base case value is represented by a circle, and the value assumed for each perturbation by a smaller square.
- S-Curve: This graph plots sample values against percentiles on a cumulative distribution or S-curve graph, showing the percentage of samples that fall below a given value.
.png)
 in the upper right corner indicates that the sensitivity simulation has not been run since the last time the model was modified, so that the displayed results (if any) are out of date.
  indicates that the sensitivity simulation has been run with the current version of the model, and the results are up to date.
- A detailed report will be output to Excel when selecting the
 Excel Reports button.
 - Use the
 button to save the current results to a .sns file.
 - By right-clicking on the graph panes you can open the graph in a separate window, or copy the graph in image format to the Windows clipboard.
 Make scenarios: Use this option to create scenarios from sensitivity iterations. A new Scenarios tool window will open with a separate scenario for each iteration.