
Distribution Correlations
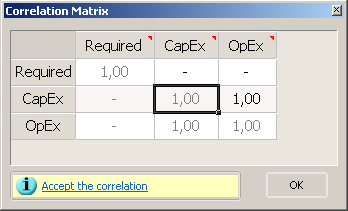
When you select two or more correlations in the Monte Carlo Control Window, you can use the  button to view the selected correlations as a matrix table, which makes it easier to edit variables that are correlated with several others. The
  red triangle indicates that what you can see is not the full name of the variable; hover the mouse pointer over it to see the full name (see Variable names).
How PetroVR Performs Correlations
Uncertain quantities usually have dependencies that influence sample standard deviations. For this reason, to assess risk more realistically probability distributions have to be complemented with correlations that represent these influences as coefficients.
PetroVR utilizes the Pearson correlation coefficients, which have been traditionally adopted as a standard way to represent influences between input variables, even though they only reveal a degree of linear proximity. The Pearson correlation coefficient between two random variables X and Y is defined as:
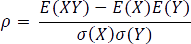
where  stands for standard deviation. Similarly, the correlation coefficient of two samples (xi)1≤i≤n and (yi)1≤i≤n is defined as:
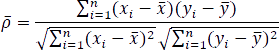
or
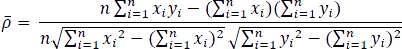
In the equations  and
and  stand for the mean values of the respective samples.