
Single Probabilistic Results Window
This window provides a graphic representation of cumulative probability and frequency distributions for a given input variable or result. It offers the following views:
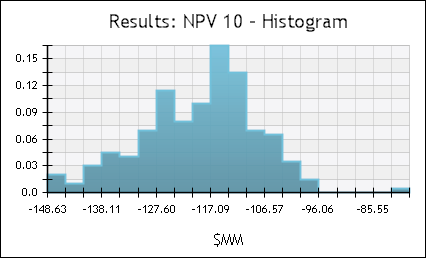
- Histogram: Plots sample value ranges against frequency (percentage of samples that fall within a range).
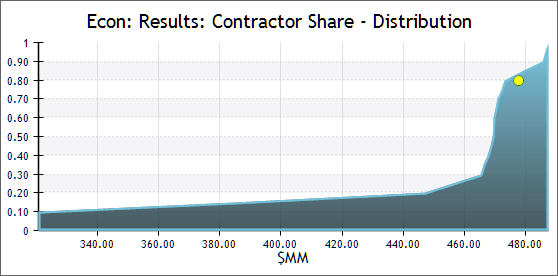
- Distribution: Plots sample values against percentiles on an S-curve graph, showing the percentage of samples that fall below a given value. A
 yellow marker indicates the deterministic value of the variable.
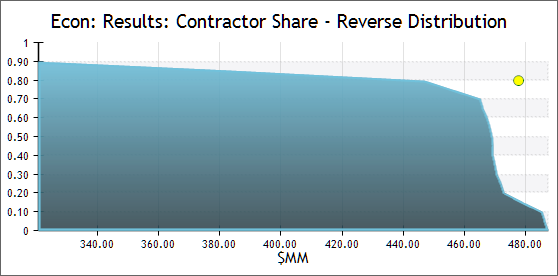
 - Reverse Distribution: Plots sample values against percentiles, showing the percentage of samples that do not fall below a given value. A yellow marker indicates the deterministic value of the variable.
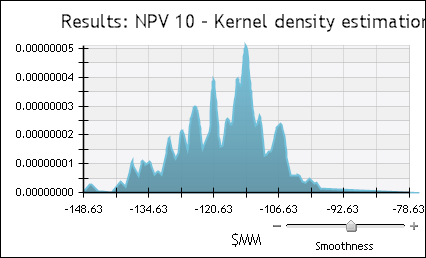
- Density: Draws a kernel density estimate curve plotting sample values against density (relative likelihood for this value). Use the Smoothness slide-bar to smooth peaks in the curve and remove noise.
- Convergence: Plots mean values against the number of iterations performed. This allows you to estimate the minimum number of iterations needed to obtain acceptable results. Use the Clustering level slide-bar to combine clusters with similar values.
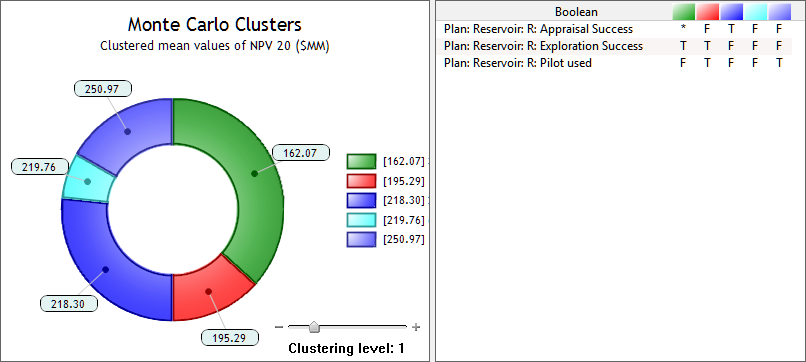
- Clusters: Groups MC iterations according to the value assumed by Boolean variables for which a distribution has been defined, i.e., variables which represent decisions that created divergent branches in the simulation. A statistical measure of each branch's likelihood is provided, as well as the mean value assumed by the variable; cluster are sorted by mean value. Use the Clustering level slide-bar to combine clusters with similar values. The table on the left shows the value assumed by each sampled Boolean variable in each cluster (represented by the color code). When two or more variables yield the same values in each cluster one is shown in black and the rest grey and between parentheses. The table on the right shows the value assumed by each variable in each cluster: T(rue) or F(alse). Combined clusters can also show an asterisk * which indicates that both T and F values are present.
.png)
In any of these graphs you have an option in the right-click menu to Use percentiles or Use samples to build the graph; using percentiles optimizes the usage of computational resources, whereas using samples ensures maximum granularity in the results displayed.
Monte Carlo samples are stored in .rdt files. Since these files may not be available, or you might wish not to open them to avoid loading a large number of data, some charts can rely on percentiles. Since percentiles stepping from 0.05 are always available from result files (.rlt) these plots are always available. If you choose to use the full set of samples, more accurate plots will be available, and simple ones showing only percentiles will be available too.
The yellow mark indicating the deterministic value only appears if the plan and Econ models have not been modified and/or executed after the last Monte Carlo run. This is so in order to ensure that the probabilistic and deterministic data displayed are compatible.